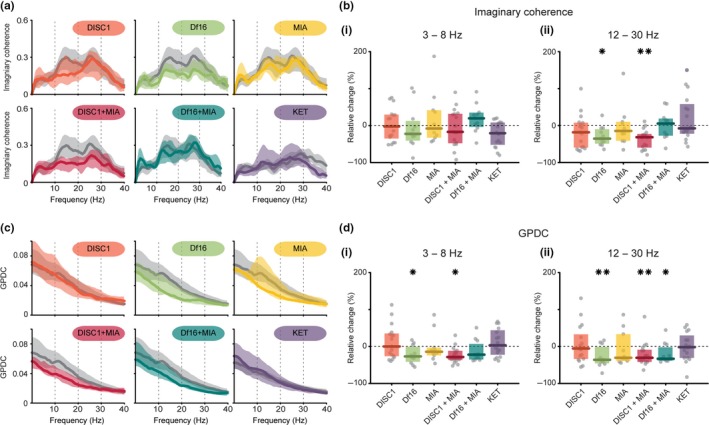
Figure 4.

Coupling between PL and i/vHP in mouse models of mental illness. (a) Averaged coherence spectra C(f) for simultaneous oscillatory periods between PL and i/vHP displayed for all mouse models (colours) together with their control (light grey). (b) (i) Scatter plot displaying the relative coherence within 3–8 Hz for all models when normalized to controls. (ii) Same as (i) in the beta (12–30 Hz) frequency band (Df16 vs. control: p = 0.038, DISC1 + MIA vs. control: p = 0.001). (c) Averaged GPDC spectra G(f) from i/vHP to PL displayed for all mouse models (colours) together with their control (light grey). (d) (i) Scatter plot displaying the relative GPDC within 3–8 Hz for all models when normalized to controls (Df16 vs. control: p = 0.044, DISC1 + MIA vs. control: p = 0.01). (ii) Same as (i) for beta (12–30 Hz) frequency band (Df16 vs. control: p = 0.006, DISC1 + MIA vs. control: p = 0.006, Df16 + MIA vs. control: p = 0.017). Thick lines represent the median, and shaded areas represent the 25° and 75° percentiles. Single data points are represented as circles, the coloured bars represent the median and the coloured boxes the 25th and 75th percentiles, *p < 0.05, **p < 0.01
