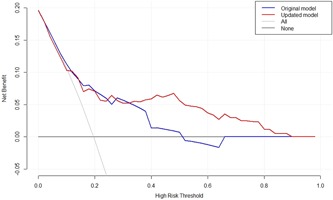
Figure 4.

Decision curve analysis showing the net benefit curve of the original model of Park et al24 (in blue) and of the final updated prognostic model (in red) for the composite poor outcome (ICU‐admission, need for mechanical ventilation and/or in‐hospital death). The horizontal gray line is the net benefit when all RSV‐infected hospitalized adults are considered as not having the poor outcome; vertical gray line is the net benefit when all RSV‐infected hospitalized adults are considered as having the poor outcome. The higher the net benefit (blue line) at any given threshold, the better the model performs. Example: with a risk threshold of 25% (threshold above which we would treat), the net benefit (derived from the true positives and true negatives) is 5.33 per 100 patients when using the original model of Park et al24 and 5.95 when using the updated model. RSV, respiratory syncytial virus; ICU, intensive care unit
