Figure 1.

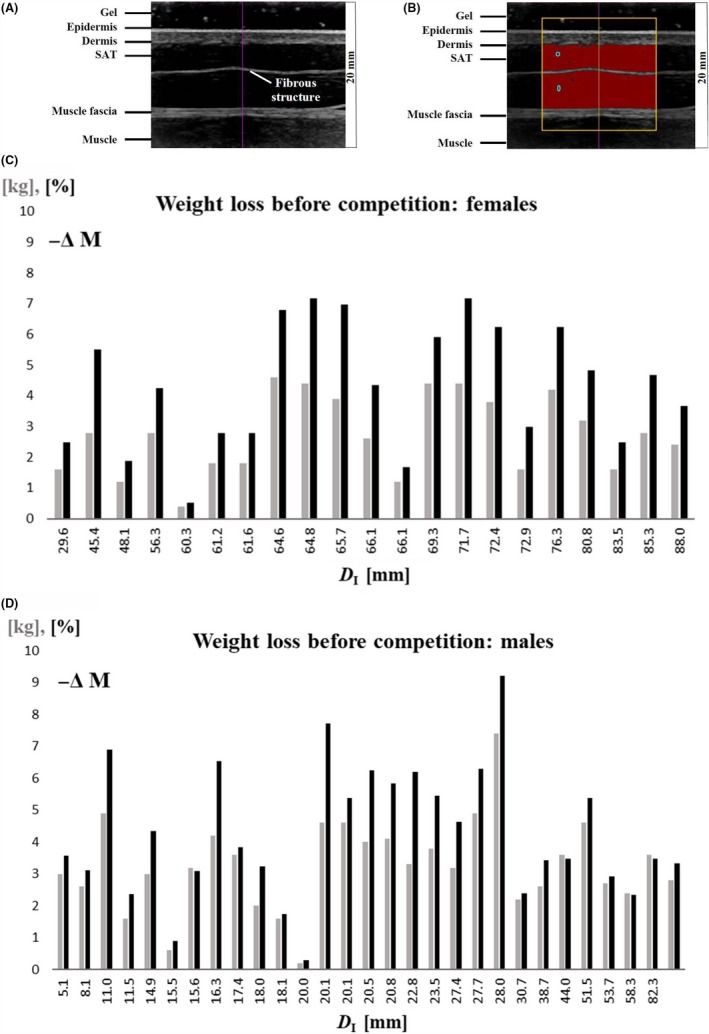
A, Typical example of an ultrasound image (US) of subcutaneous adipose tissue (SAT). Site: front thigh (FT). Tissue structures of relevance for US image evaluation are marked. B, The semi‐automatic SAT detection algorithm starts out from the blue zones. The yellow frame represents the chosen region of interest. The evaluation algorithm measured automatically 235 SAT thicknesses of the SAT layer along 235 vertical lines in this image. Mean d I = 8.10 (± 0.11) mm, d E = 7.61 (± 0.12) mm, and the difference d F = 0.49 mm (represents the mean thickness of the embedded fibrous structure). Image depth was 20 mm. C, Weight loss in all females (except for heavy weight category) before competition, in kg (grey) and in percent of body weight (black). Participants are ordered according to their sums of SAT thicknesses D I. Fig. D, as C, but for males.
