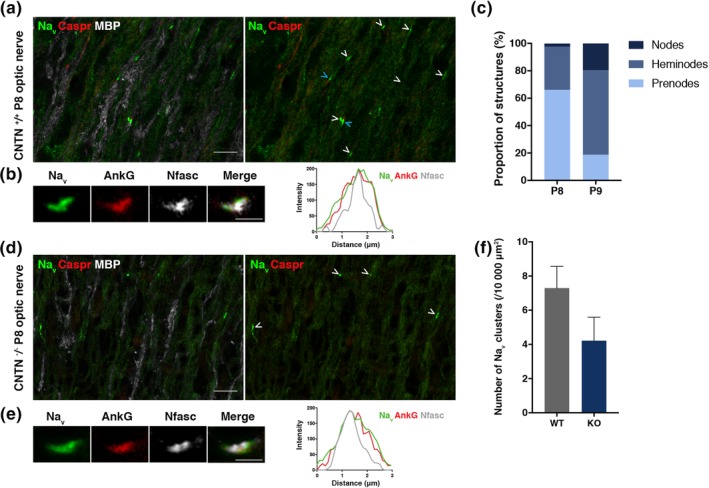
Figure 6.

Impact of CNTN on early Nav channel cluster formation in the optic nerve at P8. (a and d) immunostainings of sections of WT (a) and CNTN‐KO (D) P8 mice optic nerve show the presence of Nav clusters (green), Caspr clusters (red) in the WT (a) but not the KO condition (d), and myelin (MBP+, white). Both heminodes (blue arrowhead) and prenodal clusters (white arrowhead) are observed in the WT (a). Scale bars: 10 μm. (b and r) immunostainings of sections of WT (B) and KO (E) P8 mice optic nerve show clusters with Nav (green), AnkyrinG (red) and Nfasc (white) that are colocalizing (plot profile). Scale bars: 2 μm. (c) Quantification of the proportion of the different structures (i.e., nodes, heminodes, and prenodes or isolated Nav clusters) from images of Nav and Caspr immunostainings on WT optic nerve at P8 (n = 6 mice, 87 images) and P9 (n = 4 mice, 40 images). (f) Quantification of density of Nav clusters per 10,000 μm2 for the WT and the KO at P8, mean ± SEM, student t‐test, ns. Values were obtained from n = 6 WT and n = 5 KO animals, with 10 to 20 images acquired per animal
