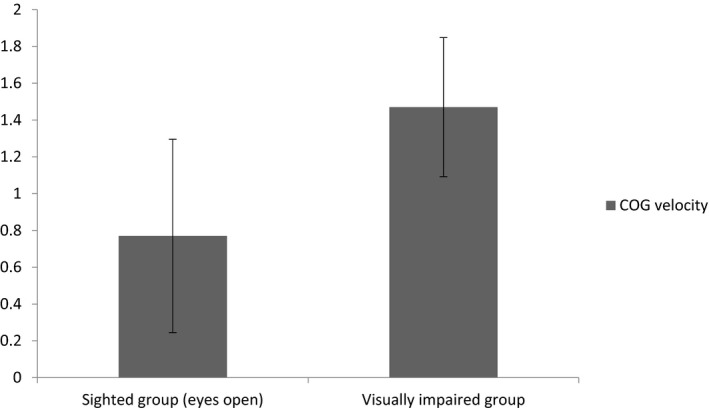
Figure 1.

Mean and standard deviation of center of gravity (COG) velocity between sighted group (n = 35) with eyes open and visually impaired group (n = 35) while standing on a foam surface. Note the significant difference (p < .0001) between the two groups of subjects
