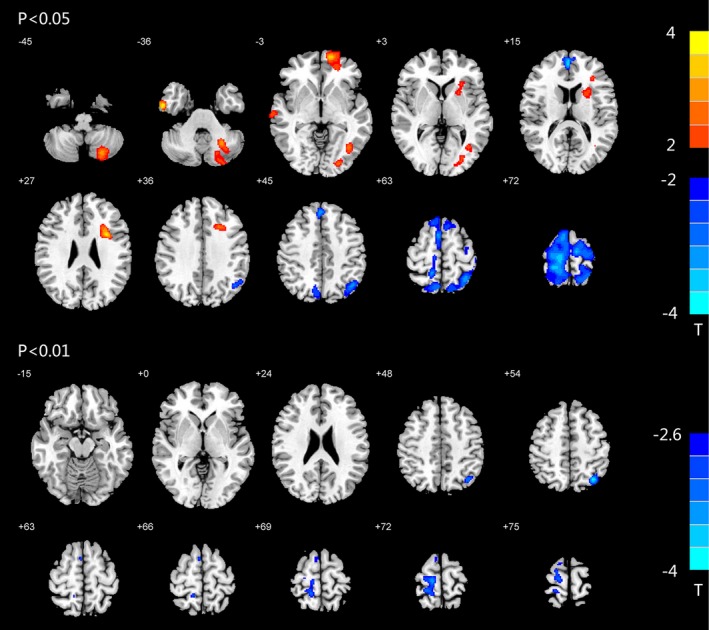
Figure 2.

Altered BEN in rTLE patients. BEN differences between rTLE patients and healthy controls. Red and blue colors indicate increased and decreased BEN, respectively. The colored bars indicate the range of t‐values; T: t‐values; p < .05, p < .01: Statistical threshold of AlphaSim correction, voxel > 140
