Figure 1.

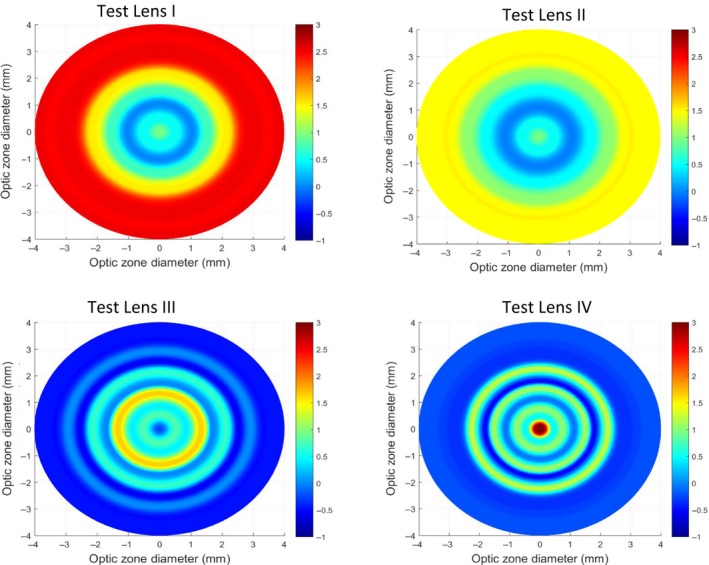
2‐D plot depicting the power profile across the optical zone of the test lenses. x‐ and y‐ axes represent the optical zone diameter and the colours represent the power.

2‐D plot depicting the power profile across the optical zone of the test lenses. x‐ and y‐ axes represent the optical zone diameter and the colours represent the power.