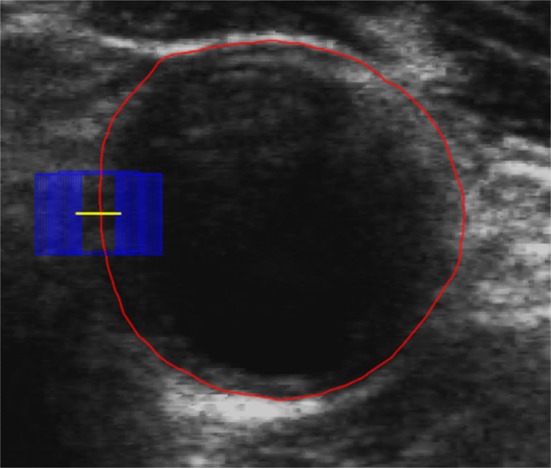
Figure 5.

Generate patches along norm line of each initial MAB. The red contour is the initial contour, the yellow line is the generated norm line and the blue rectangle is a patch extracted along the norm line. [Color figure can be viewed at http://wileyonlinelibrary.com]
