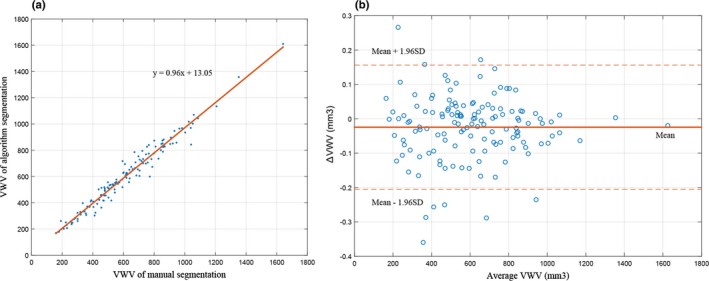
Figure 9.

(a) Correlation plot for algorithm‐ and manually generated three‐dimensional ultrasound vessel‐wall‐volume (VWV). (b) Bland–Altman plot of the difference between VWVs generated by algorithm and manual segmentations. The red continuous line labeled as mean indicates the bias, the dotted lines labeled as 1.96 SD indicate the level of agreement. [Color figure can be viewed at http://wileyonlinelibrary.com]
