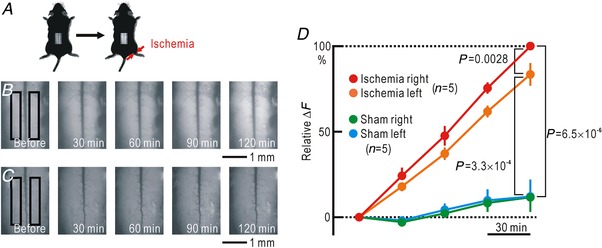
Figure 7. Visualized spinal NO production during right hindpaw ischaemia using DAF‐FM.

A, experimental method. B, images of the spinal cord covered with 2% agarose gel containing 20 μM DAF‐FM. The time after the onset of ischaemia in the right hindpaw is shown in each image. The intensity of the fluorescence is shown on an arbitrary grey scale. The black rectangles represent ROIs for measurement of fluorescence intensity. C, images of the spinal cord covered with 2% agarose gel containing DAF‐FM. In this experiment, sham treatment without pressure was applied to the right hindpaw. D, relative amplitudes of the increases in fluorescence normalized by those recorded 2 h after the onset of right hindpaw ischaemia in the right side of the spinal cord. [Color figure can be viewed at http://wileyonlinelibrary.com]
