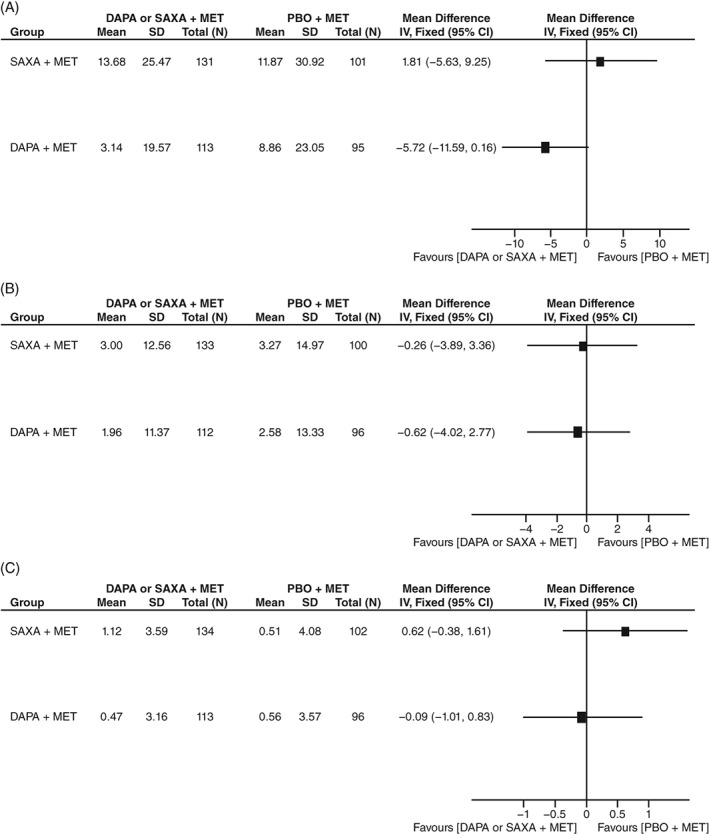
Figure 2.

Forest plots showing placebo‐adjusted indirect comparisons of 20‐week to 102‐week CoF for DAPA + MET vs SAXA + MET with respect to A, FPG, B, SBP and C, body weight. CoF, coefficient of failure; DAPA, dapagliflozin; FPG, fasting plasma glucose; IV: instrumental variable; MET, metformin; PBO: placebo; SAXA, saxagliptin; SBP, systolic blood pressure; SD, standard deviation
