
Figure 4.
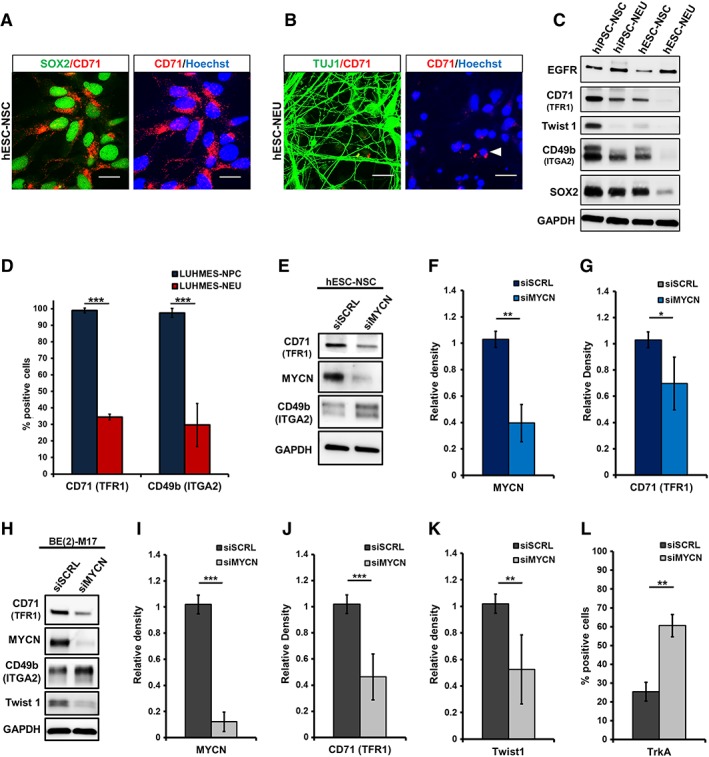
Alteration in total protein expression of CD71 (TFR1) and CD49b (ITGA2) upon neuronal differentiation and MYCN‐knockdown. (A): Immunocytochemistry for CD71 (red), costained with neural stem/precursor cell (NSC)‐marker SOX2 (green) in human embryonic stem cell (hESC)‐NSC. (B): hESC‐neurons/neuroblasts (NEU) stained for CD71 (red) and NEU/NB‐marker TUJ1 (green); Hoechst (blue: nuclei). (C): Western blot analysis of NSC and NEU derived from hESC and hiPSC. Samples were probed for EGFR, CD71, Twist1, CD49b, and SOX2; loading control: GAPDH. (D): Proliferative LUHMES midbrain precursor cells (NPC) and differentiated LUHMES cells (NEU) analyzed by flow cytometry for CD71 and CD49b surface expression. The bar graph represents the mean percentage of positive cells for both markers (n ≥ 4). (E): Western blotting for siRNA‐mediated knockdown (KD) of MYCN in hESC‐NSC. (F, G): Quantification shows a significant downregulation of MYCN and TFR1 (n = 3). (H): MYCN‐KD in MYCN amplified neuroblastoma cell line BE(2)‐M17. Immunoblotting demonstrates the downregulation of CD71, MYCN, and Twist1 upon MYCN knockdown. Scrambled siRNA (siSCRL) and GAPDH were used as controls. (I, J, K): Western blot quantification for MYCN, CD71, and Twist1 post‐MYCN‐KD (n = 6). (L): Flow cytometric quantification of TrKA expression upon MYCN‐KD showed a significant increase in the number of TrKA+ cells (n = 3). Knockdown of MYCN (N‐Myc) significantly downregulated CD71 (TFR1) expression (scale bar: 20 μM; *, p < .05; **, p ≤ .01; ***, p ≤ .001; unpaired Student's t test).