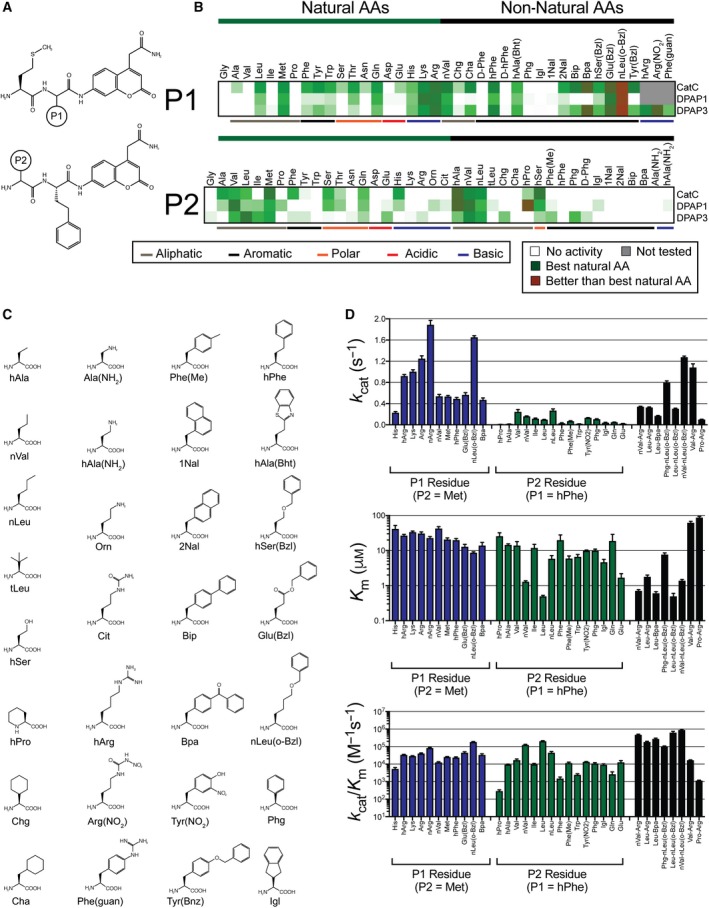
Figure 1.

DPAP3 substrate specificity. (A) Structure of P1 and P2 substrate libraries. (B) Heat map comparing relative turnover rates for the different DPAPs at 1 μm substrate. For each enzyme and substrate, turnover rates were normalized relative to the best natural AA (dark green): Arg in P1 for all DPAPs; Met, Val and Leu in P2 for CatC, DPAP1, and DPAP3 respectively. Red indicates substrates that are turned over better than the best natural AA. White represents no activity, and grey substrates that were only tested on DPAP3. (C) Structure of non‐natural AAs used in the substrate library. (D) Steady‐state Michaelis–Menten parameters for DPAP3 determined for selected substrates. Error bars represent the standard deviation of each parameter (N = 3‐10 depending on the substrate, see Table 1).
