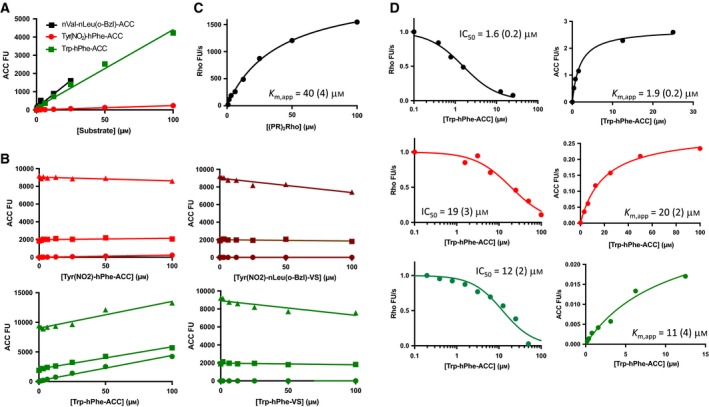
Figure 2.

Substrate quenching and substrate competition studies. (A) Background fluorescence signal of selected substrates measured in assay buffer. Note that Tyr(NO 2)‐hPhe‐ACC shows a very low level of background fluorescence compared to Trp‐hPhe‐ACC or nVal‐nLeu(o‐Bzl)‐ACC (Fig. 3A) likely indicating intramolecular quenching between ACC and Tyr(NO 2). (B) ACC fluorescence signal measured at increasing concentrations of the indicated substrates and inhibitors in the presence at 0 (circles), 1 (squares) or 5 (triangles) μm of free ACC. (C) (PR)2Rho turnover by DPAP3. (D) Turnover rates of (PR)2Rho (left graphs) and ACC substrates (right graphs) measured at 40 μm of (PR)2Rho and increasing concentrations of ACC substrates. K m,app and IC 50 values are indicated in each graph. Numbers in parentheses represent the standard error of the fit (N = 1).
