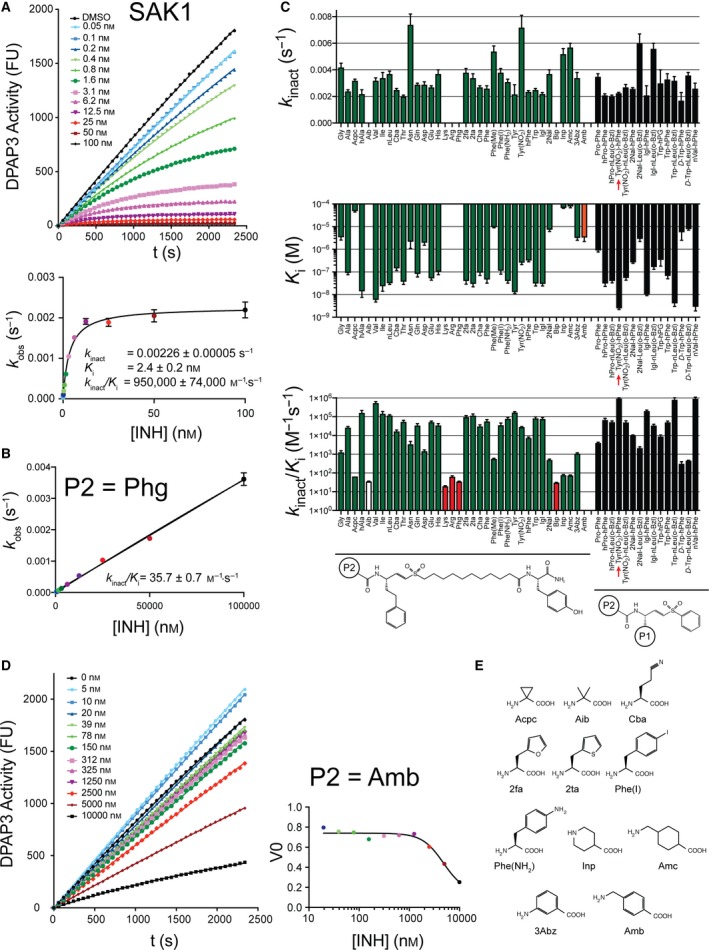
Figure 3.

DPAP3 inhibitor specificity. (A) Representative data showing time‐dependent inhibition of DPAP3 by SAK1 (Tyr(NO 2)‐hPhe‐VS). Each progress curve (FU vs. time) was fitted to Eqn. 5 to obtain k obs values (top graph). These were then fitted to Eqs. 6 and 7 to obtain k inact, K i and k inact/K i. Progress curves and corresponding k obs values at each inhibitor concentration are shown in different colours. (B) Example of an inhibitor where no inhibitor saturation was observed (white bars in C). In this case, k obs values were fitted to a linear model to obtain k inact/K i. (C) Inhibition constants determined for DPAP3. The general structure of the inhibitors is shown below the graphs. Red bars correspond to inhibitors for which only k inact/K i values could be determined. The orange bar corresponds to the only inhibitor that showed a reversible mechanism of inhibition, that is, only a K i value could be determined. The inhibitor corresponding to SAK1 is indicated with a red arrow. (D) No time‐dependence inhibition of DPAP3 was observed with an inhibitor with a P2 Amb. Initial turnover rates (V 0) were fitted to a reversible binding model to obtain K i. Progress curves and corresponding V 0 values at each inhibitor concentration are shown in different colours. (E) Structure of non‐natural AAs present in the inhibitor library but not in the substrate library. Error bars represent the standard error of the global fit for each parameter obtained by fitting k obs values vs. inhibitor concentration (1 or 2 technical replicates per compound) to Eqs. 6 or 7.
