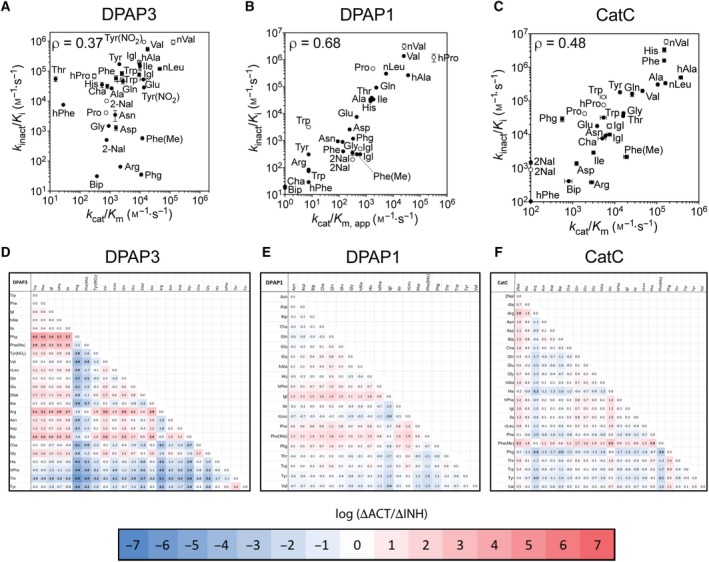
Figure 4.

Comparison of catalytic efficiency and second‐order inhibition constants. (A–C) Comparison of k inact/K i and k cat/K m for DPAP3 (A), DPAP1 (B) and CatC (C) between vinyl sulfone inhibitors and P2 substrate library. For DPAP1, apparent k cat/K m (k cat/K m,app) were calculated based on previously reported turnover rates at 1 μm 35. k cat/K m,app were calculated similarly for DPAP3 and CatC for P2 substrates whose activity was too low to obtain accurate Michaelis–Menten parameters (i.e., substrates not present in Tables 1 and S2). Filled circles correspond to compounds belonging to the vinyl sulfone library (compounds in Table 2), and empty circles to inhibitors having a phenyl group in P1′ (Table 4). The P2 residue is labelled next to each data point. Pearson correlation coefficients (ρ) are shown for each protease and were calculated using the default function in Prism. Error bar represents the standard error of the fit for each parameter. (D–F) Comparison of changes in substrate turnover relative to inhibitor potency for any pair of P2 residues for the P2 substrate library and the VS inhibitor library (both with P1 hPhe). The log value of ΔACT/ΔINH (Eqn. 2) calculated for DPAP3 (D), DPAP1 (E) and CatC (F) are shown as a heat maps with values above and below zero in red and blue respectively. Each pairwise value showing more than a 100‐fold discrepancy between activity and inhibition (ΔACT/ΔINH > 100 or < 0.01) is highlighted in bold.
