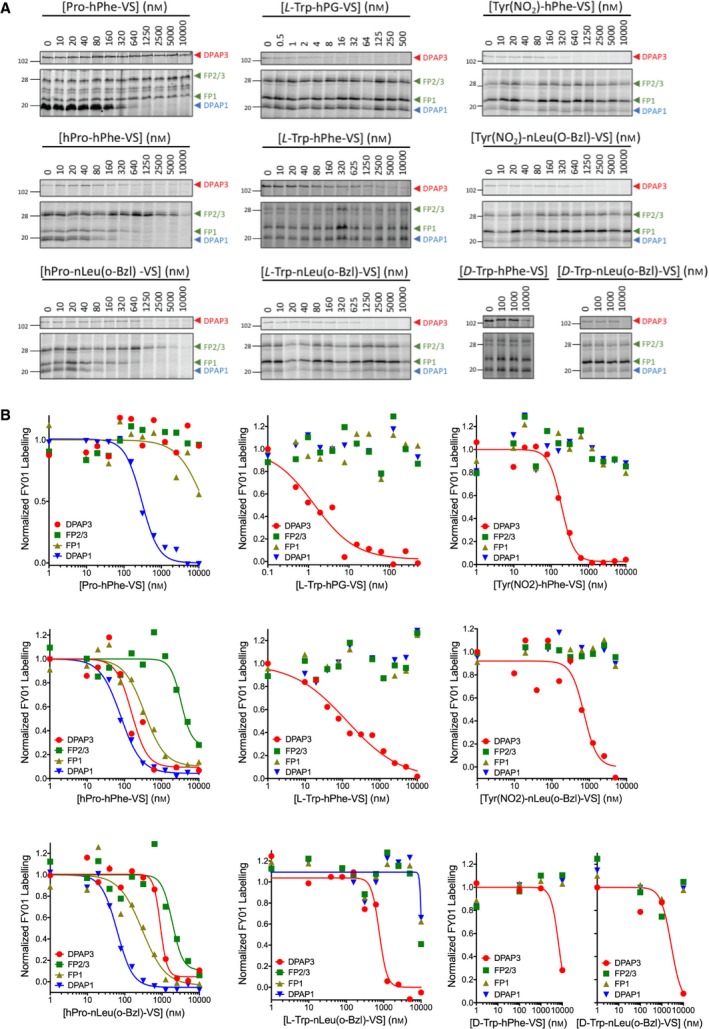
Figure 6.

Selective inhibition of DPAP1 or DPAP3 in live parasites. Intact mature schizonts were pretreated for 30 min with increasing concentrations of inhibitor followed by 1 h treatment with FY01. Samples were then run in an SDS/PAGE gel and the in‐gel fluorescence measured using a fluorescence scanner. (A) Representative gel images obtained for each of the inhibitors. Fluorescent bands corresponding to the different cysteine proteases labelled by the probe are indicated with arrowheads (DPAP3, red; FPs, green; DPAP1, blue). (B) The fluorescence intensity of each of the indicated bands was quantified by densitometry using ImageJ, and the fluorescence values normalized to the DMSO control. IC 50 values are reported in Table 5. Note that control inhibitors containing D‐Trp are more than 1000‐fold less potent than those with L‐Trp. Three technical replicates were performed; dose responses for a representative replicate are shown.
