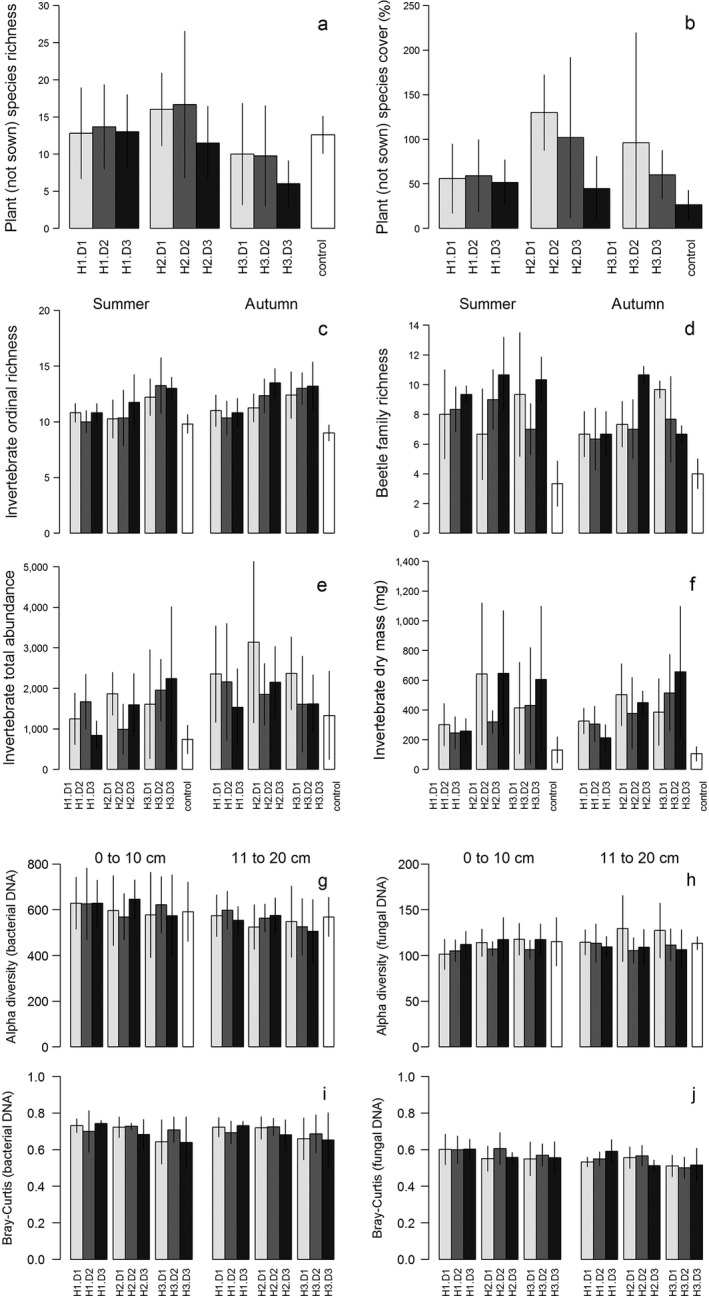
Figure 2.

Plant and invertebrate community properties by treatment and by season for invertebrates and depth for the soil community. Treatment combinations along the x‐axis correspond to Fig. 1. Bars are organized from short (left) to tall (right) treatments, with small gaps between the height groups, and diversity treatment is indicated by gray shading; light gray, low diversity; medium gray, medium diversity; black, high diversity. White bars represent the unmanipulated control. Bars are the mean per treatment combination with standard deviation bars. Plants are represented by (a) non‐sown plant richness and (b) percent cover. The invertebrate community is represented by (c) order‐level richness, (d) Coleoptera family richness, (e) total community abundance, and (f) estimated total community biomass. The soil taxonomic community is represented by alpha diversity of (g) bacterial and (h) fungal operational taxonomic units (OTUs) and the difference of the (i) bacterial and (j) fungal DNA communities from the composition of the unmanipulated control. Error bars show ± SD.
