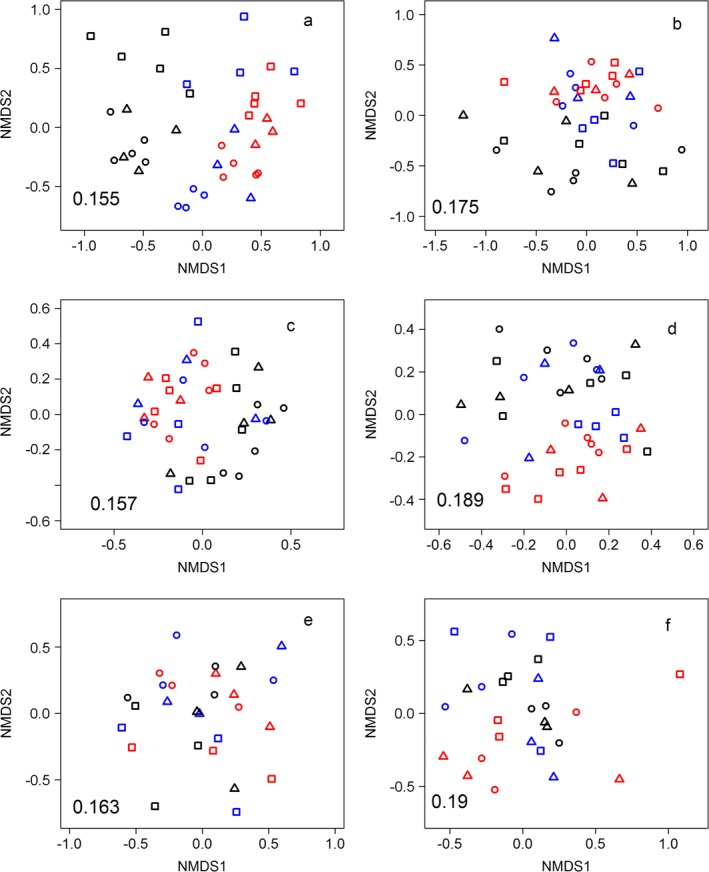
Figure 3.

Nonmetric multidimensional scaling ordinations of (a) the whole plant community, (b) the non‐sown plant community, (c) the order‐level invertebrate community in summer and (d) in autumn, and (e) the Coleoptera family‐level community in summer and (f) in autumn. Points represent communities in each plot, coded by height (red, H1 [short]; blue, H2 [medium]; black, H3 [tall]) and diversity (square, D1 [low]; triangle, D2 [medium]; circle, D3 [high]). Stress values are in the bottom left of the plot space. Only the first two axes (NMDS1 and NMDS2) are shown, although all ordinations required three axes to reduce stress to <0.20, except for the order and Coleoptera communities in autumn.
