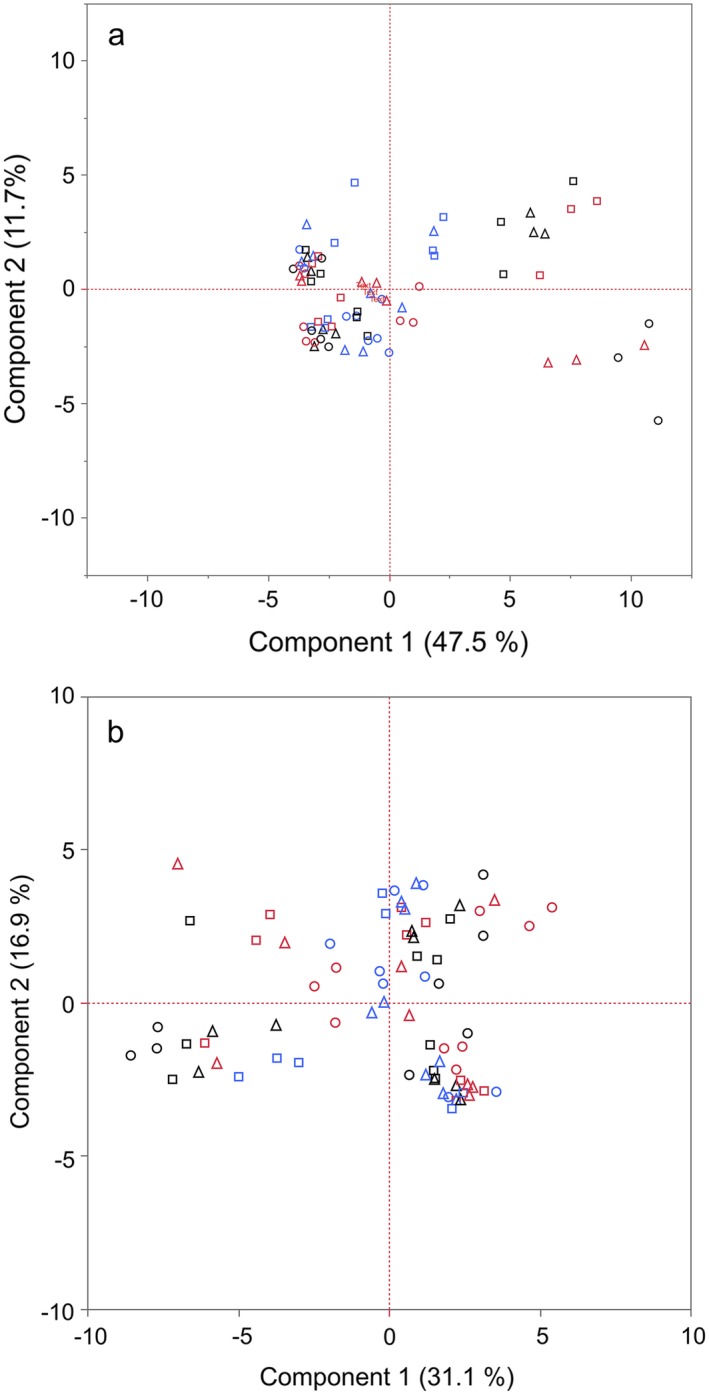
Figure 4.

Biplots of the principal component scores of the phospholipid fatty acid profiles of the soil microbial community at (a) 0–10 cm depth and (b) 11–20 cm depth. The percentages on the axes refer to the variance described by the component represented on that axis. Points represent communities in each plot, coded by height (red, H1 [short]; blue, H2 [medium]; black, H3 [tall]) and diversity (square, D1 [low]; triangle, D2 [medium]; circle, D3 [high]).
