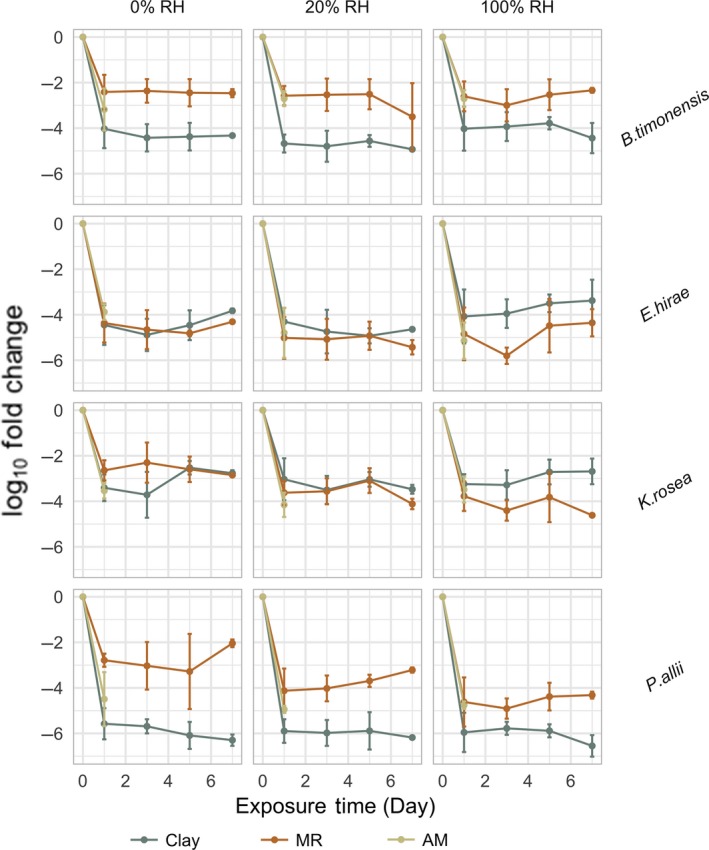
Figure 6.

PMA‐qPCR log10 fold change normalized to the starting abundance of each species. Both B timonensis and P allii demonstrated statistically significant differences in surface survival on MR and Clay surfaces for all humidity levels (0%, 20%, and 100%), whereas the survival patterns for E hirae and K rosea were only significantly different under 100% RH (Table S2). Swab samples from MR and Clay surfaces were collected on Days 1, 3, 5, and 7, whereas samples from the antimicrobial surfaces were only collected on the day following the inoculation
