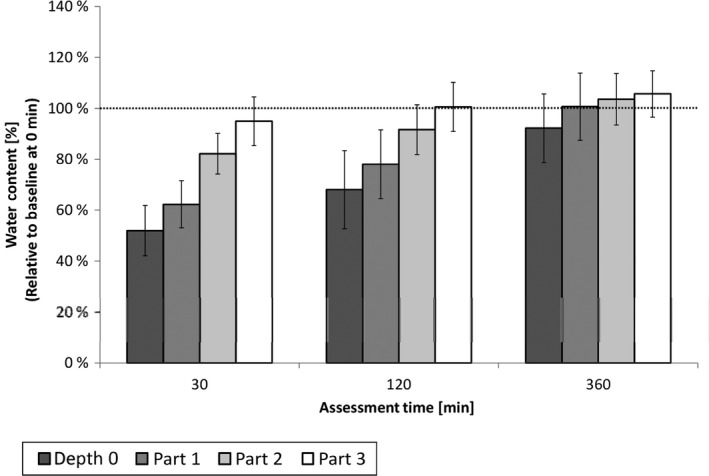
Figure 3.

Water Content in the SC at different depth and points of time relative to baseline before product application (= 100%), means and 95% confidence intervals (n = 15). At skin surface (depth 0 μm) and AUC within SC+SD: part 1 = upper SC, part 2 = middle SC, part 3 = deep SC as illustrated in Fig. 2.
