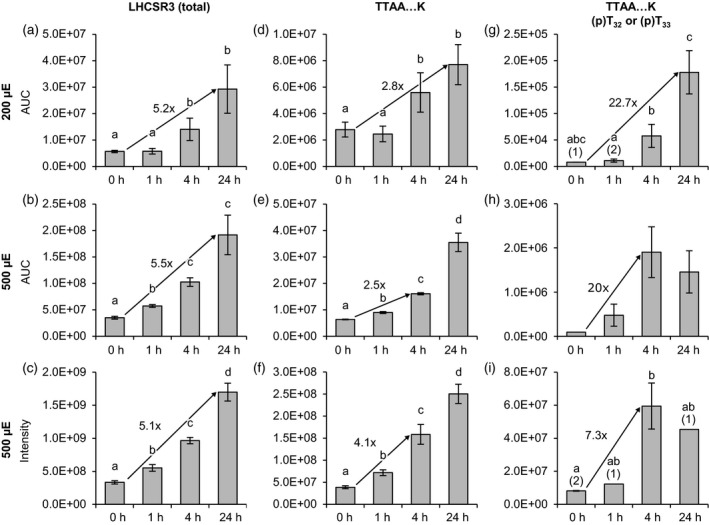
Figure 1.

Changes in LHCSR3 abundance and phosphorylation (T32/T33) in response to different light conditions. Algal cultures were exposed to 200 μmol photons m−2 sec−1 (200 μE; a, d, g) or 500 μmol photons m−2 sec−1 (500 μE; b, e, h) highlight in HS medium and samples were taken at the indicated time points. Label‐free quantification was performed by parallel reaction monitoring (PRM, top and middle rows). Peptide and protein abundances are represented as ‘areas under curve’ (AUC). The AUCs of two proteotypic peptides were summed to reflect total LHCSR3 abundance. For the 500 μmol photons m−2 sec−1 experiment supplementary quantitative data was obtained by label‐free quantification using the MaxLFQ algorithm (c, f, i). (a−c) Total LHCSR3. (d−f) PeptideT32T33AAEPQTAAPVAAEDVFAYT, nonphosphorylated. (g−i) Peptide (p)T32(p)T33AAEPQTAAPVAAEDVFAYT, singly phosphorylated at either T32 or T33. Data represent mean ± standard deviation (200 μmol photons m−2 sec−1: n = 4; 500 μmol photons m−2 sec−1 (PRM): n = 3 (0 h: n = 2), 500 μmol photons m−2 sec−1 (MaxLFQ): n = 3). Numbers in parentheses indicate the number of data points if low abundances did not permit quantification in all replicates. Welch's t‐test (unpaired, two‐tailed) was used to analyze the data: Values labelled with identical letters, or no letters, do not show statistically significant differences (P > 0.05) (p), phosphorylated residue. Only kinetics of protein abundance changes, but not absolute protein or peptide levels are comparable between the two high light experiments, since samples were analyzed with different LC‐MS configurations.
