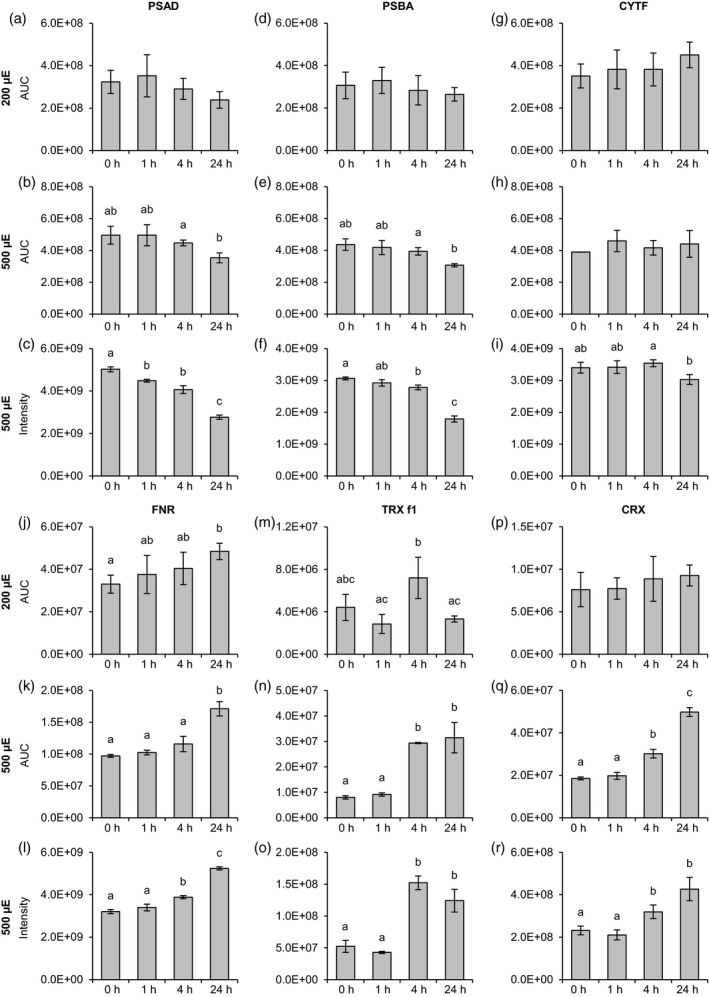
Figure 2.

Changes in the abundances of photosynthetic and redox‐related proteins in response to different light conditions. Algal cultures were exposed to 200 μmol photons m−2 sec−1 (200 μE; a, d, g, j, m, p) or 500 μmol photons m−2 sec−1 (500 μE; b, e, h, k, n, q) highlight and samples were taken at the indicated time points. Label‐free quantification was performed as described in Figure 1. For the 500 μmol photons m−2 sec−1 experiment supplementary quantitative data was obtained by label‐free quantification using the MaxLFQ algorithm (c, f, i, l, o, r). (a−c) Photosystem I reaction center subunit II (PSAD). (d−f) Photosystem II protein D1 (PSBA). (g−i) Cytochrome f (CYTF). (j−l) Ferredoxin:NADP+ oxidoreductase (FNR). (m−o) Thioredoxin f1 (TRX f1). (p−r) Calredoxin (CRX). Data represent mean ± standard deviation (200 μmol photons m−2 sec−1 : n = 4; 500 μmol photons m−2 sec−1 (PRM): n = 3 (0 h: n = 2), 500 μmol photons m−2 sec−1 (MaxLFQ): n = 3). Welch's t‐test (unpaired, two‐tailed) was used to analyze the data: Values labelled with identical letters, or no letters, do not show statistically significant differences (P > 0.05). (p), phosphorylated residue. Only kinetics of protein abundance changes, but not absolute protein or peptide levels are comparable between the two high light experiments, since samples were analyzed with different LC‐MS configurations.
