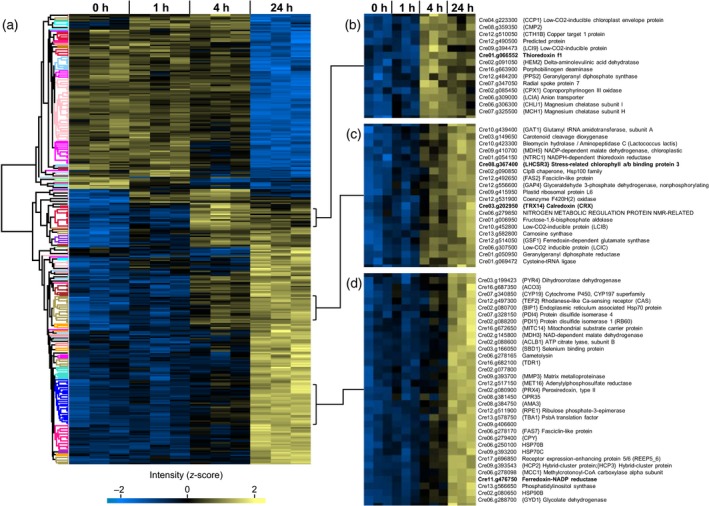
Figure 3.

Temporal changes of protein levels in response to high light (500 μmol photons m−2 sec−1). Quantitative data was obtained from non‐targeted (DDA) LC‐MS/MS experiments. Clustering (average linkage, Euclidean distance) is based on normalized and z‐scored log2 protein intensities. Each lane represents one biological replicate. (a) Hierarchical cluster analysis of 327 proteins with significantly (P < 0.01, anova) altered abundances. (b–d) Magnified views of subclusters containing TRXf1 (b), LHCSR3/CRX (c) and FNR(d).
