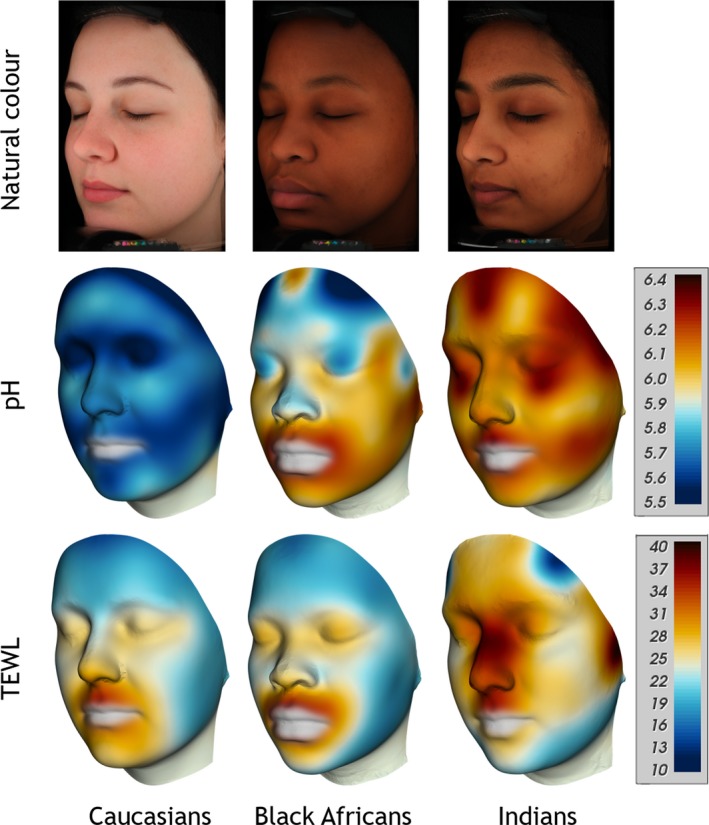
Figure 6.

Colour mappings of skin surface pH and transepidermal water loss (TEWL) displayed on a mean face per group, from left Caucasians, Black Africans, Indians. Top row: standard VISIA‐CR portraits in cross‐polarised light mode, natural skin colour. Middle row: skin surface pH mappings, Bottom row: TEWL mappings. Colour code for pH values (5.5‐6.4) and TEWL values (10‐40 g m−2 h−1) shown on the scales on the right side.
