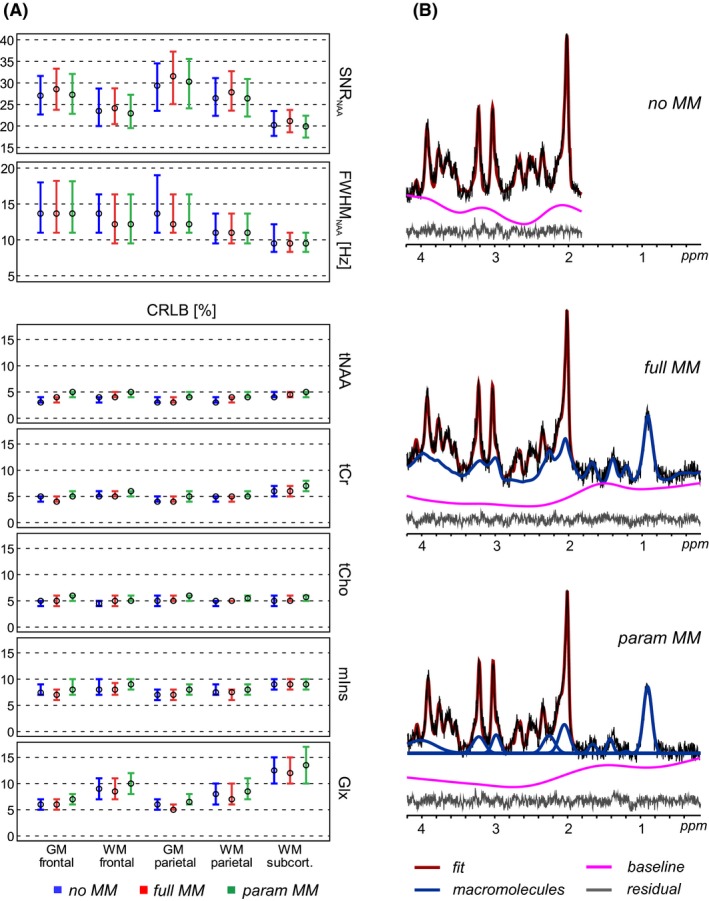
Figure 1.

(A) Spectral quality (SNR, linewidth) and quantification precision (Cramér‐Rao lower bounds) parameters. The circles and errror bars show the 25th percentile, median, and the 75th percentile of the total number of analyzed voxels. (B) Representative spectra obtained by FID‐MRSI and quantified in LCModel by 3 different MM prior knowledge models: no MM, with no MM information; full MM, with a single measured MM spectrum; and param MM, with 9 individual MM components included. The fitted baselines have been subtracted from the metabolite and MM spectra. These subtracted baselines and the residua are displayed separately below each LCModel fit. MM, macromolecular
