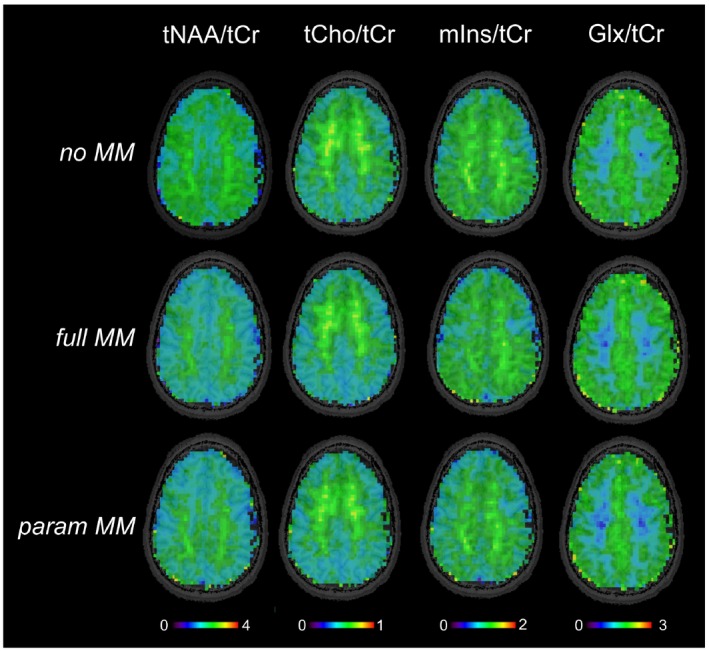
Figure 2.

Metabolite maps of one volunteer obtained by FID‐MRSI with 64 × 64 resolution. The quantification of spectra was performed in LCModel using 3 basis sets with different macromolecular prior knowledge included: with no MM information, with a single in vivo MM spectrum (full MM), and with 9 parameterized MM components (param MM) with soft constraints
