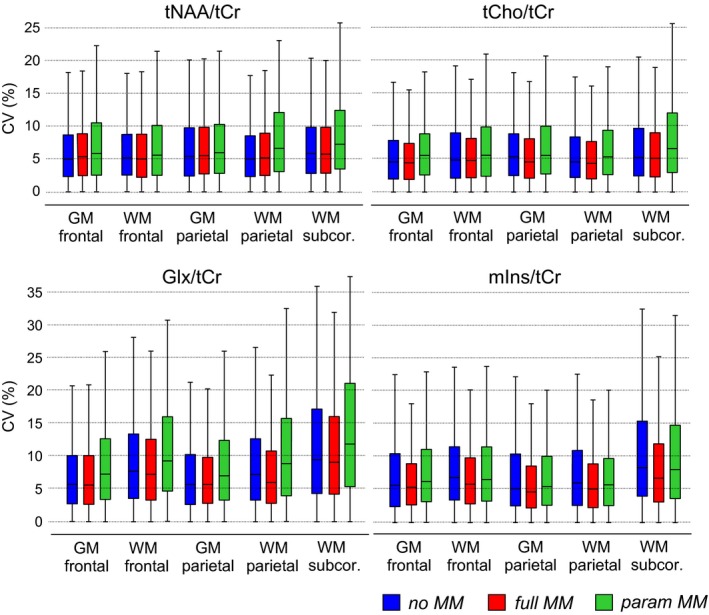
Figure 4.

CV values for the voxel‐based analysis of the metabolite ratios obtained by different MM prior knowledge included in the basis sets: no MM, with no MM information; full MM, with a single measured MM spectrum; and param MM, with 9 individual MM components with soft constraints. The box‐and‐whisker‐plots represent the minimum, 25th percentile, median, 75th percentile, and maximum number of the analyzed voxels. CV, coefficient of variations
