
Figure 1.
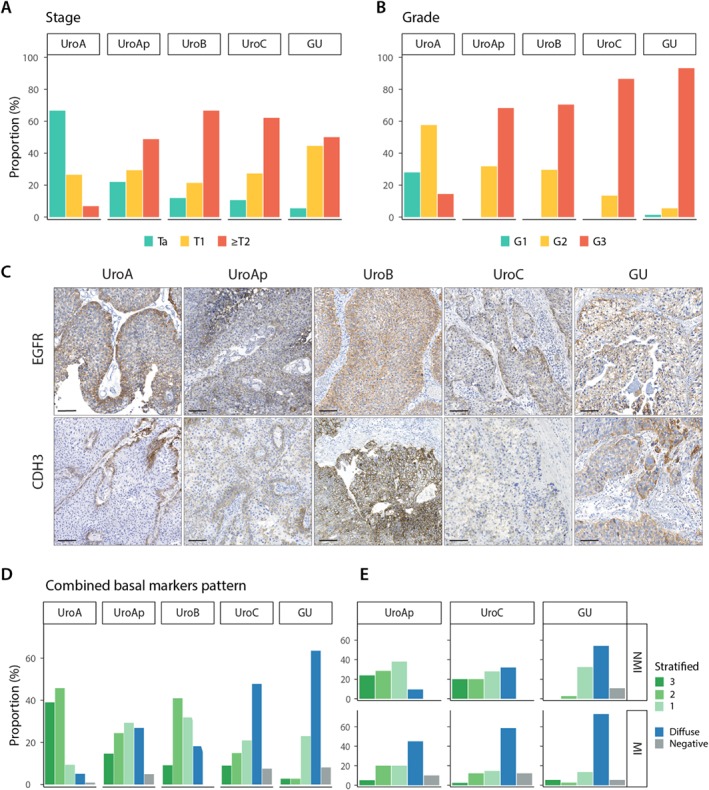
Pathological stage and grade, and expression of EGFR, CDH3, and KRT5 in the luminal subtypes. (A,B) Distribution of pathological stage and grade of the samples within each molecular subtype. (C) Representative IHC staining for EGFR and CDH3 for each molecular subtype. (D) Distribution of the combined basal markers EGFR, CDH3, and KRT5 expression patterns within each molecular subtype. Labels: 3, all markers show stratified expression; 2, two markers show stratified expression; 1, one marker shows stratified expression; diffuse, no marker shows stratified expression and at least one shows diffused staining; 0, all markers are negative. (E) The same data as in D divided into nonmuscle and muscle‐invasive cases for UroAp, UroC, and GU subtypes. UroA and UroB are excluded from this analysis due to low number of cases in one of the groups.