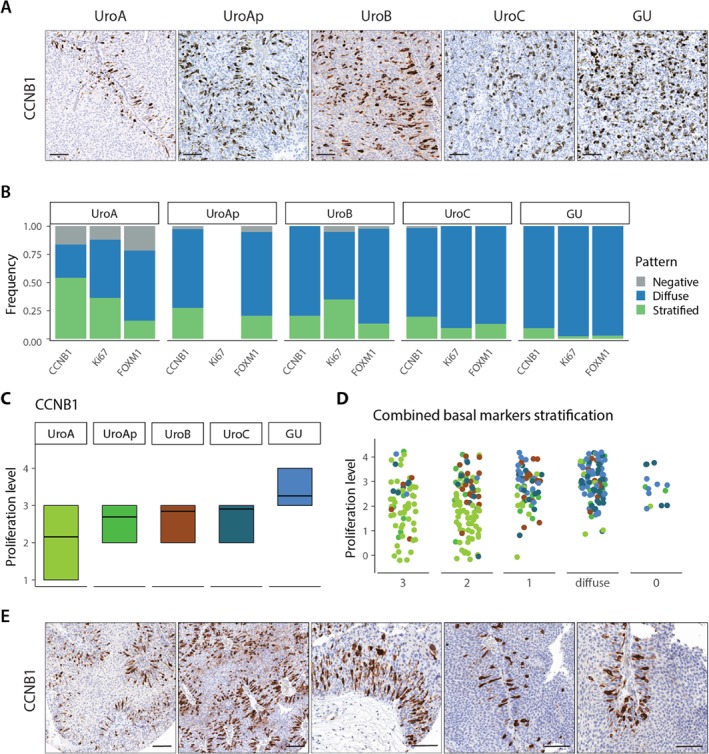
Figure 3.

Expression of proliferation makers. (A) Representative images of CCNB1 expression for the respective molecular subtypes. Notice the stratified expression in UroA. (B) Frequency of staining patterns of CCNB1, Ki67, and FOXM1 within each molecular subtype. Ki67 data not available for UroAp. (C) Proliferation level of the tumor samples within each molecular subtype as determined by the fraction of CCNB1 positive tumor cells. Proliferation levels: 1, <10%; 2, 10–20%; 3, 20–50%; 4, 50–80%; 5, >80%. (D) Distribution of the proliferative levels of the samples divided by the combined staining patterns of the basal markers EGFR, CDH3, and KRT5. Labels; 3, all markers show stratified expression; 2, two markers show stratified expression; 1, one marker shows stratified expression; diffuse, no marker shows stratified expression and at least one shows diffused staining; 0, all markers are negative. Samples are colored according to their molecular subtype as in plot C. (E) Examples of CCNB1 staining in UroA tumors showing the association of proliferation with the basal cell layer.
