Figure 4.

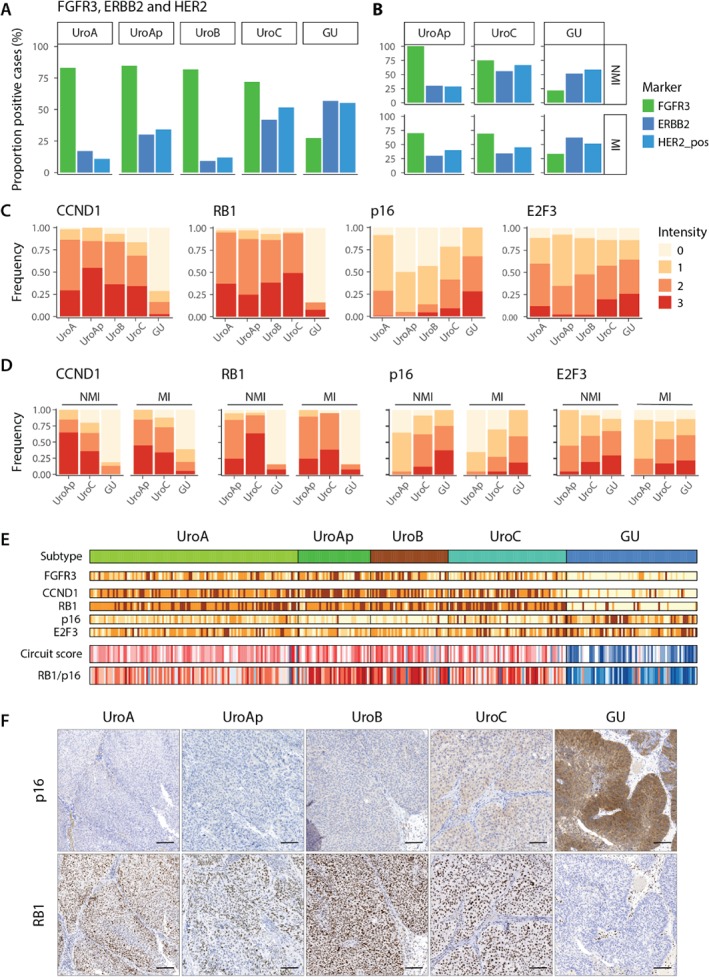
Expression of FGFR3 and ERBB2, and cell cycle regulating proteins. (A) Fraction of FGFR3 and ERBB2 positive and clinically HER2 cases within each molecular subtype. (B) The same data as in A given for UroAp, UroC, and GU divided into nonmuscle and muscle invasive cases. (C) Distribution of staining intensity levels of CCND1, RB1, p16, and E2F3 within each molecular subtype. (D) Same data as in C given for UroAp, UroC, and GU divided into nonmuscle and muscle invasive cases. Data for UroA and UroB not given due to too few samples in the respective groups. (E) Samples within each subtype ordered based on pathological grade and tumor stage. For each individual case a circuit score was calculated as FGFR3+CCND1+RB1‐E2F3 19 as well as a RB1/p16 ratio, using staining intensities. Color codes; yellow, low staining intensity; dark brown, high staining intensity. Red, score or ratio above threshold, blue, score or ratio below threshold. (F) Representative p16 and RB1 staining for the respective molecular subtypes.
