
Figure 5.
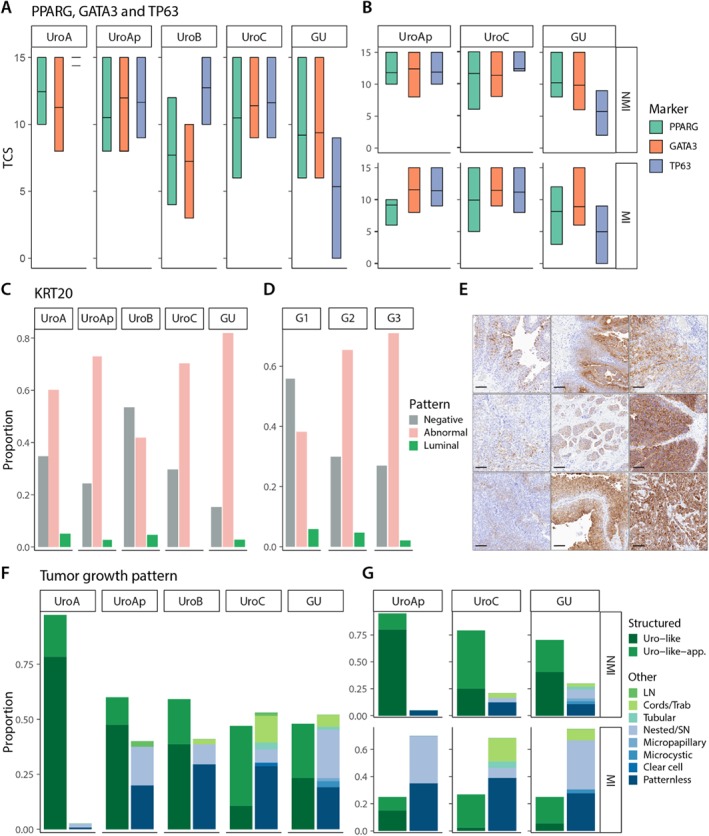
Cellular differentiation and growth patterns. (A) Expression levels of PPARG, GATA3, and TP63 indicated as tumor cell scores for each luminal subtype. (B) Same data as in C given for UroAp, UroC, and GU divided into nonmuscle and muscle invasive cases. (C,D) Frequency of the different KRT20 expression patterns within each molecular subtype and histologic grade. (E) Examples of aberrant KRT20 expression. (F) Distribution of different growth patterns within each molecular subtype. The growth patterns are grouped into urothelial pattern or nonurothelial pattern (other). (G) The same data as in F given for UroAp, UroC, and GU divided into nonmuscle and muscle invasive cases. Data for UroA and UroB not given due to too few samples in the respective groups.