
Figure 6.
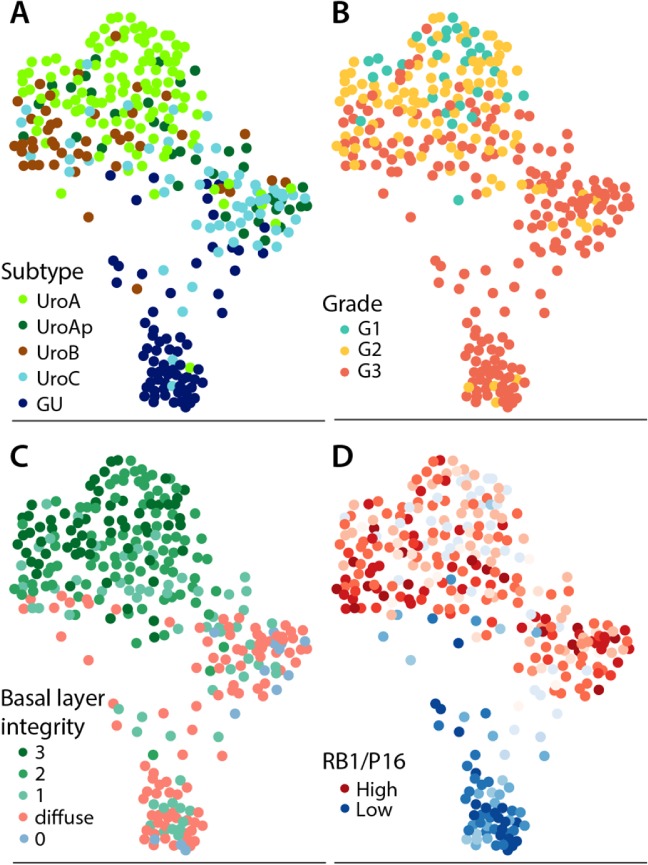
SPRING graph of tumor cases based on similarity of molecular pathological features. Cases were scored for the variables: combined basal markers, CCNB1, FGFR3, HER2, CCND1, RB1, p16, PPARG, GATA3, TP63, and KRT5 expression, and then organized in a k‐nearest neighbor two‐dimensional graph using the SPRING algorithm. Each point represents a tumor sample. The clusters are labeled according to (A) the LundTax, (B) the pathological grade (WHO 1999), (C) combined stratified expression of EGFR, CDH3, and KRT5. Labels: 3, all markers show stratified expression; 2, two markers show stratified expression; 1, one marker shows stratified expression; diffuse, no marker shows stratified expression and at least one shows diffused staining; 0, all markers show negative staining. (D) Cases labeled according to the RB1/p16 ratio. Red: high ratio; blue: low. High ratio indicates expression of p16 but not RB1.