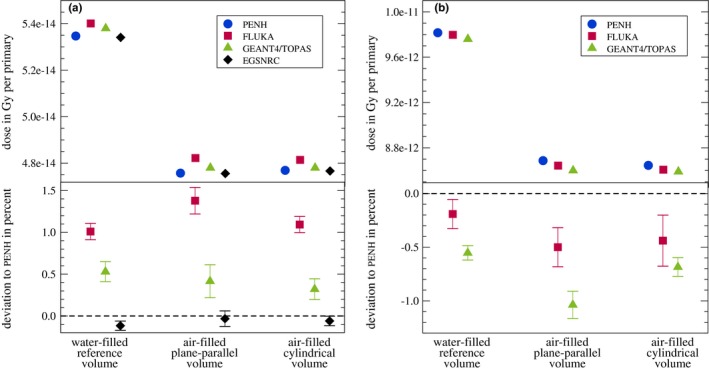
Figure 2.

Absorbed dose in Gy per primary scored in each volume from Fig. 1 for all Monte Carlo codes. (a) 1.25 MeV photons, (b) 150 MeV protons. In the bottom graph, the deviations relative to penh are shown (see text for explanation). The statistical uncertainties of the absolute absorbed doses are smaller than the symbol size. The statistical uncertainties represented by bars in the bottom graphs correspond to one standard deviation. [Color figure can be viewed at http://www.wileyonlinelibrary.com/]
