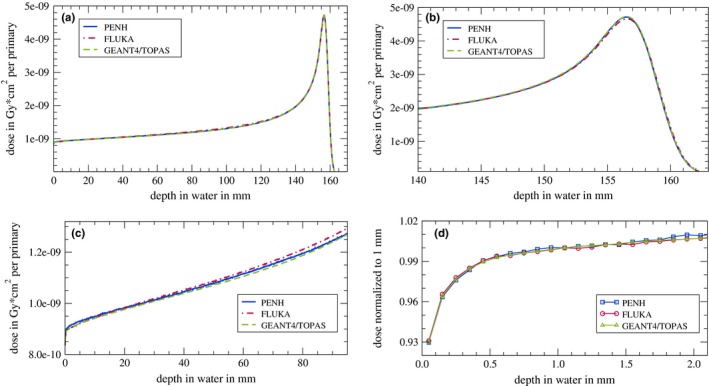
Figure 6.

(a) Integrated depth–dose curve of 150 MeV protons in water (dose integrated over an area of 100 cm). (b) Zoom to the Bragg peak. (c) Zoom to the first 90 mm. (d) Zoom to the first 2 mm while the dose values are normalized to the dose at a depth of 1 mm. The single data points in (d) are connected with lines to guide the eye. No statistical uncertainties are indicated since one standard deviation is smaller than the line width [panels (a)–(c)] or the symbol size [panel (d)]. [Color figure can be viewed at http://www.wileyonlinelibrary.com/]
