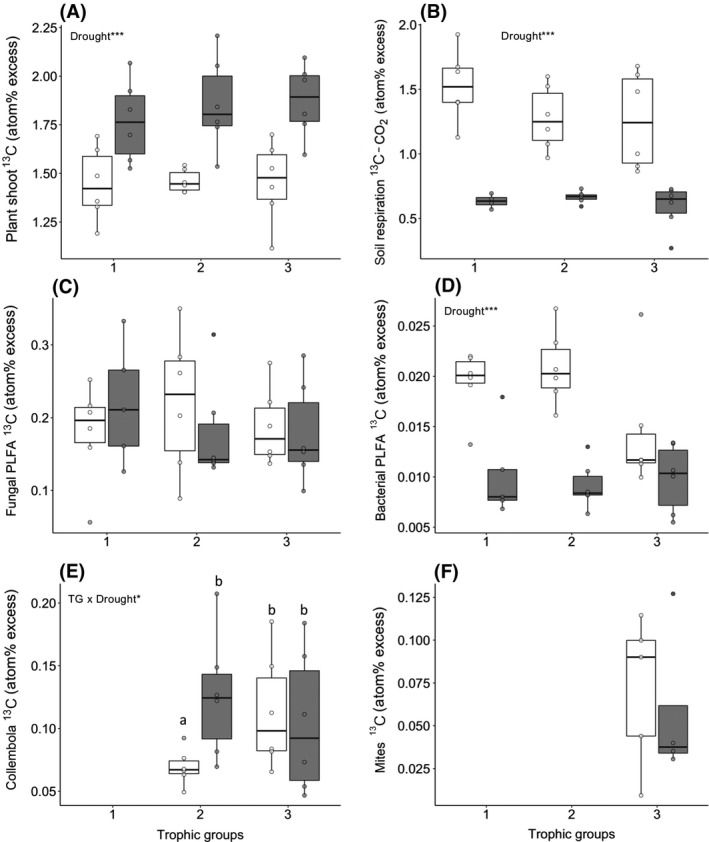
Figure 2.

13C enrichment of the different carbon pools as a function of the food web trophic complexity (one, two or three trophic groups) and drought (control in white and drought in grey): Above‐ground plant (A), soil CO2 efflux (B), bacterial PLFA (C), fungal PLFA (D), Collembola (E) and Acari (F). Lines in boxes represent median, top and bottom of boxes represent first and third quartiles, whiskers represent the largest value no further than 1.5 interquartile range; dots represent single observations. Only the significant terms of the ANOVA are presented (*p < .05; **p < .01; ***p < .001). Tukey comparison between trophic groups are indicated by different letters, a < b
