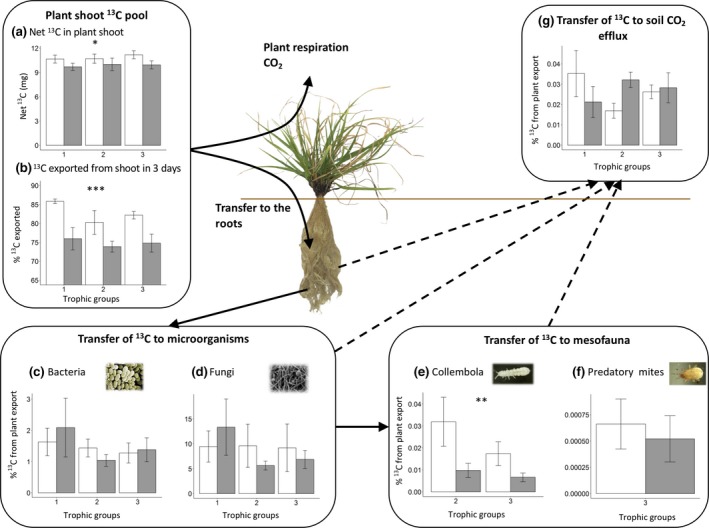
Figure 3.

Quantification of the major pools and fluxes of 13C labelled recent plant assimilate in response to food web trophic complexity (1, 2 or 3 trophic groups) and drought (control in white and drought in grey). Net 13C (mg) in plant shoots immediately after the pulse labelling (a) and 13C exported from plant shoots (comprising either allocation to roots or lost as plant respiration) after 3 days expressed as a percentage of the net 13C fixed (b). From the amount of 13C (mg) exported from plant shoots, we calculate the percentage transfer to different carbon pools comprising bacteria (c), fungi (d), Collembola (e), predatory Acari (f) and soil CO2 efflux (g). The soil CO2 efflux includes root respiration and was measured during the first 24 hr after the labelling. Mean ± SE, significant differences among drought are indicated by asterisks (*p < .05; **p < .01; ***p < .001)
