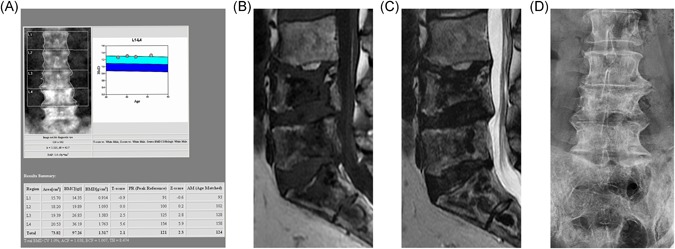
Figure 3.

The lumbar spine of a patient with GD and recurrent bone crises despite therapy. All images taken several years after last acute bone crisis. (A) DXA image. Note the increased BMD in L3 and L4. These vertebrae were not excluded from the report, despite the variation in BMD among vertebrae, contrary to best practice. The total lumbar vertebral BMD reported is therefore artifactually elevated. (B) T1‐weighted MR image showing widespread, low‐signal geographic changes in L4, L5, and the sacrum, features indicative of osteonecrosis. Central endplate depression is also seen. (C) T2‐weighted image showing double‐line sign indicative of osteonecrosis best seen in S1 and S2 segments and areas of low signal in the bodies of L4 and L4. Low signal in both T1‐ and T2‐weighted images indicates osteosclerosis. (D) Plain anteroposterior lumbar spine radiograph in the same patient show osteosclerosis of the body of L4. The increased density at L4 and L5 is therefore a result of osteosclerosis, consequent upon osteonecrosis, although a contribution from endplate depression cannot be excluded
