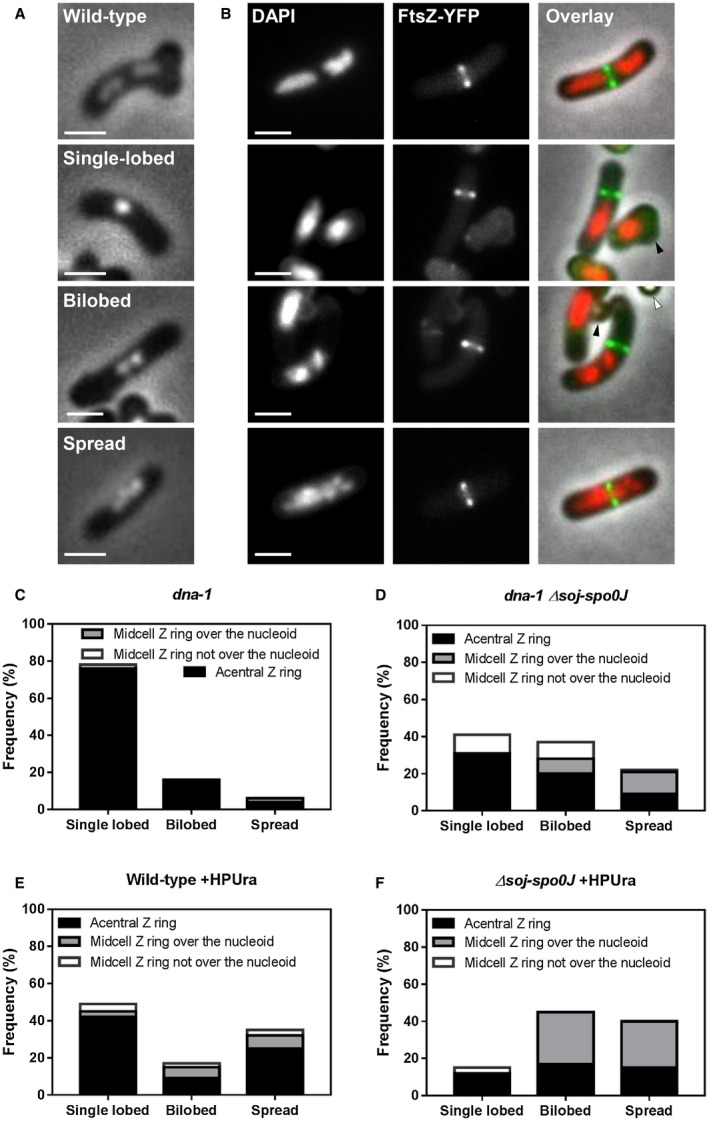
Figure 2.

Dual analysis of nucleoid morphologies and Z rings positions when the early stages of DNA replication are blocked in the absence of soj‐spo0J. A. Different nucleoid morphologies observed including a wild‐type cell with replication occurring normally, and when initiation of DNA replication is blocked: (top to bottom) wild‐type, single‐lobed, bilobed and spread nucleoid. B. Representative images of wild‐type cells (top image) and predominant combinations Z ring positions and nucleoid types quantified when the early stages of DNA are blocked: acentral Z ring adjacent to a single‐lobed nucleoid, central Z ring forming over a spread nucleoid, acentral Z ring adjacent to spread nucleoid and acentral Z ring forming over a spread nucleoid. Representative images above show in each column: DAPI (0.4 µg ml−1; left); FtsZ‐YFP (middle); and an overlay of the three preceding images (right). Images also show ungerminated spores (white arrows) and remnant spore coats (black arrows). Scale bar represents 2 μm. C–F. Histogram representation of Z ring position relative to different nucleoid type in (C) dna‐1; SU764, (D) dna‐1 Δsoj‐spo0J; SU768, (E) Wild‐type; SU492 +HPUra and (F) Δsoj‐spo0J; SU767 +HPUra. Spore samples were germinated and grown at either (C–D) the permissive temperature for 20 min and then shifted to the non‐permissive for a further 90 min; or (E–F) the permissive temperature for 120 min with media supplemented with HPUra (100 μM). The height of each bar represents the frequency of each nucleoid type, showing the proportion of acentral Z rings (black), midcell Z rings over the nucleoid (grey) and midcell Z rings not over the nucleoid (white). n > 200 for each strain.
