
Figure 5.
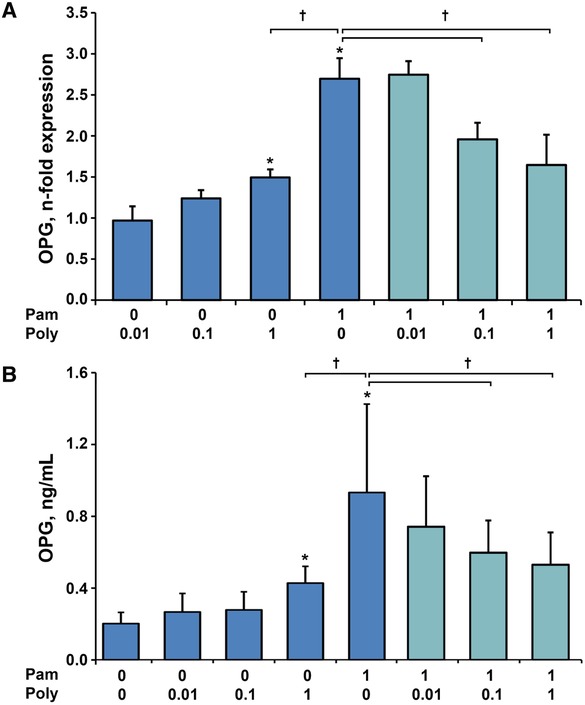
Gene expression levels of OPG in hPDLSCs and OPG protein concentration in conditioned media of hPDLSCs in response to either Poly I:C or Pam3CSK4 and in response to simultaneous stimulation. Primary hPDLSCs were stimulated with single TLR agonist (blue bars, concentrations are given in µg/ml) or their combinations (teal bars) for 24 hours. Resulting gene expression levels of OPG were measured with qPCR qPCR and are represented as n‐fold expression in relationship to untreated cells (A). Protein concentration of OPG in the conditioned media (B) was analyzed with ELISA. All data are presented as mean ± SEM of 10 values obtained in independent experiments on hPDLSCs from 10 different healthy donors. *Significantly higher versus control (untreated cells), P < 0.05. †Significantly different between simultaneous stimulation with Poly I:C and Pam3CSK4 and single stimulation with Pam3CSK4