
Figure 4.
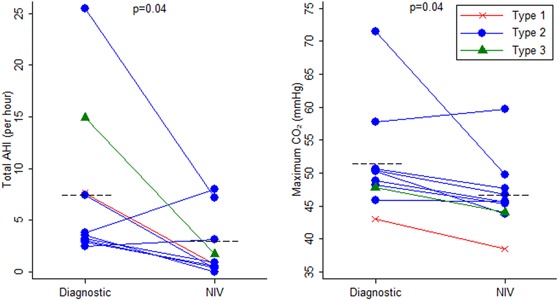
Change in total apnea‐hypopnea index and maximum transcutaneous carbon dioxide level from diagnostic sleep study to noninvasive ventilation titration study. AHI, apnea‐hypopnea index, NIV, noninvasive ventilation [Color figure can be viewed at wileyonlinelibrary.com]