Figure 1.

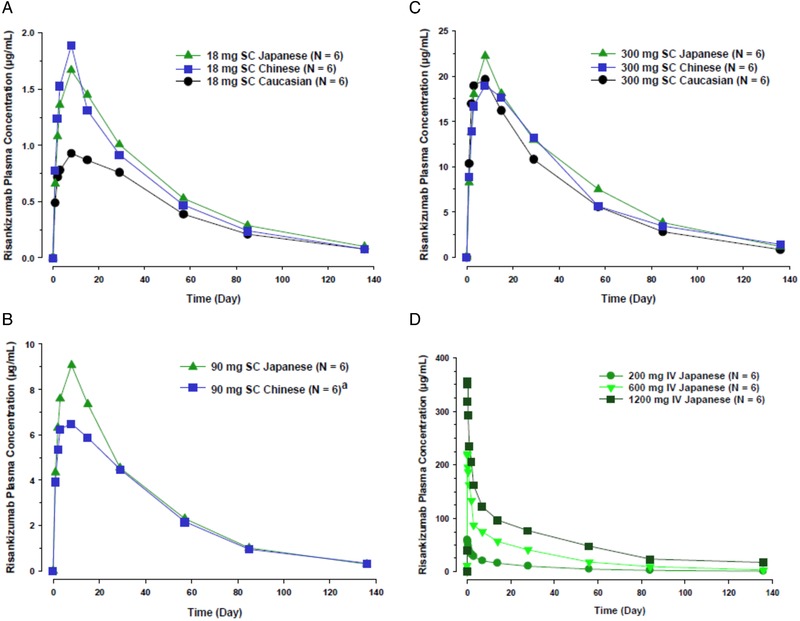
Risankizumab mean plasma concentration‐time profile following single subcutaneous (SC) doses in panels A, B, and C or intravenous (IV) doses in panel D in healthy subjects.

Risankizumab mean plasma concentration‐time profile following single subcutaneous (SC) doses in panels A, B, and C or intravenous (IV) doses in panel D in healthy subjects.