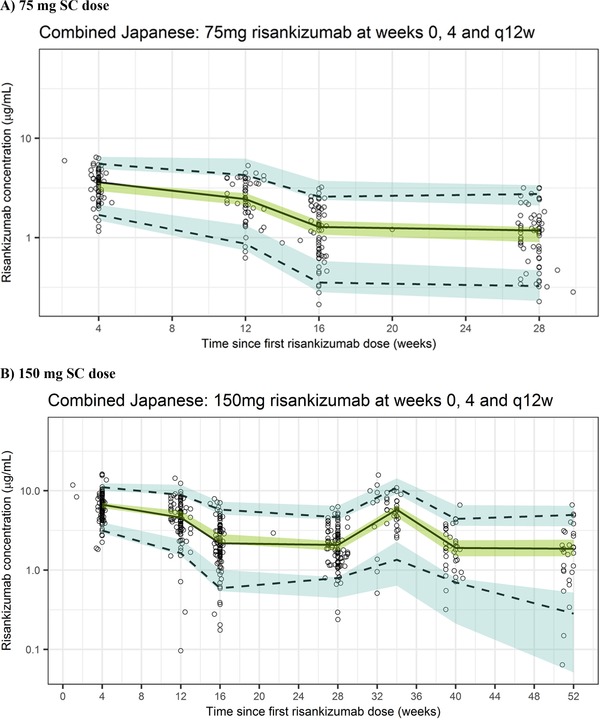
Figure 3.

Visual predictive checks across phase 2/3 studies in Japanese patients with psoriasis who received risankizumab 75 mg SC (A) or 150 mg SC (B) at weeks 0 and 4 and every 12 weeks (q12w) thereafter using the updated population pharmacokinetic model. The black circles represent observed data; the lines represent observed median (solid black) and observed 5%/95% percentiles (dashed); the shaded regions represent the 95%CIs for the simulated median (green) and simulated 5%/95% percentiles (blue).
