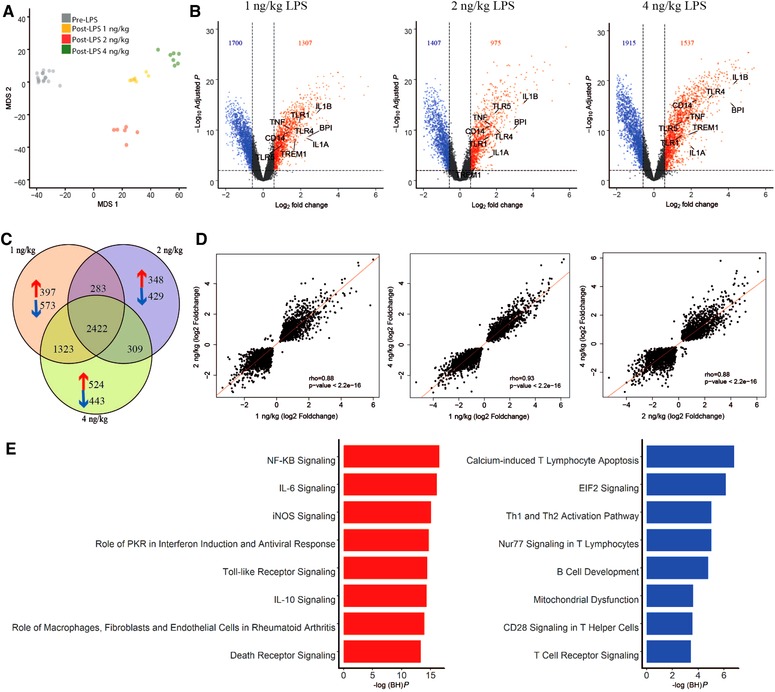
Figure 1.

Genome‐wide analysis of shared and distinct leukocyte responses across LPS doses relative to baseline. (A) Multidimensional scaling (MDS) plot of all genes across LPS doses (post‐LPS samples (T = 4 h)) relative to pre‐LPS (T = 0 h). (B) Volcano plot (integrating log2 fold changes and multiple comparison adjusted P values) representing the transcriptional changes that occur at 1, 2, and 4 ng LPS (T = 4) compared with pre‐LPS (T = 0). Numbers in top left and right corners indicate number of genes with significantly differential expression, up‐regulated (red) or down‐regulated (blue). Horizontal line represents the multiple‐test adjusted significance threshold (P < 0.01) and vertical line represents the log fold change (FC = ±0.58). Gray dots show the genes that were not significantly overexpressed or under expressed according to this threshold. (C) Venn–Euler representation of differentially expressed genes in 1, 2, and 4 ng post‐LPS versus pre‐LPS. Red arrows denote overexpressed genes; blue arrows denote under expressed genes and the numbers show the common genes among different dosages. (D) Dot plot depicting the correlation (rho, Spearman correlation coefficient) between the common responses between 1 ng versus 2 ng, 1 ng versus 4 ng, and 2ngversus 4 ng. (E) Ingenuity pathway analysis of the common response gene expression signatures in all the doses relative to baseline. Red bars, overexpressed pathways; blue bars, under expressed pathways
