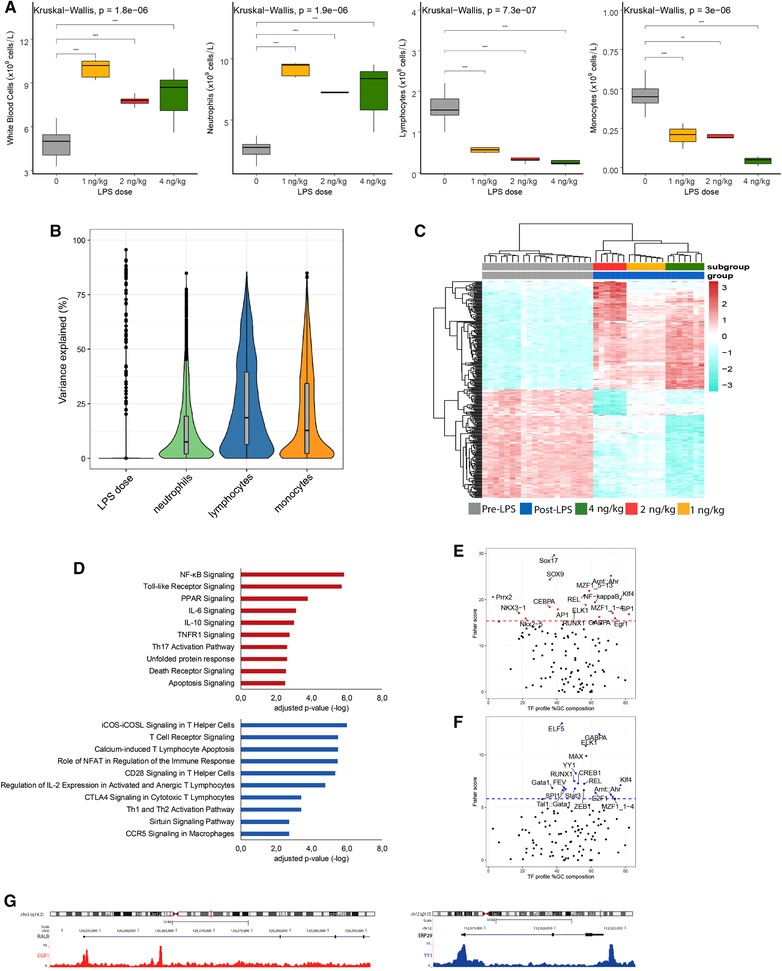
Figure 3.

Leukocyte transcriptomics, cell composition, and LPS dose‐dependent response. (A) Total WBCs, neutrophils, lymphocytes, and monocytes significant differences between the baseline and post‐LPS groups: *P < 0.05, **P < 0.01, ***P < 0.001, and ns (not significant). (B) The proportion of explainable variance at gene level. (C) Heatmap plot of the highly and lowly expressed genes from the 295 genes signature (ranked by Cohen's D effect size estimate) identified in a multivariate linear model that accounted for neutrophil, monocyte, lymphocyte counts, and nonexperimental batch. (D) Bar graphs showing significantly enriched ingenuity canonical signaling pathways considering overexpressed genes (red bars) or underexpressed genes (blue bars) (E). Single‐site analysis with oPOSSUM, using high expressed genes, revealing the overrepresented transcription factor binding motifs. The dotted line is the Fisher score threshold (mean + 1*standard deviation). (F) Single‐site analysis with oPOSSUM, using low expressed genes, revealing the overrepresented transcription factor binding motifs. (G) A genome browser snapshot showing CHIP‐peaks for EGR1 and YY1 transcription factors in RALB and ERP29 genes
