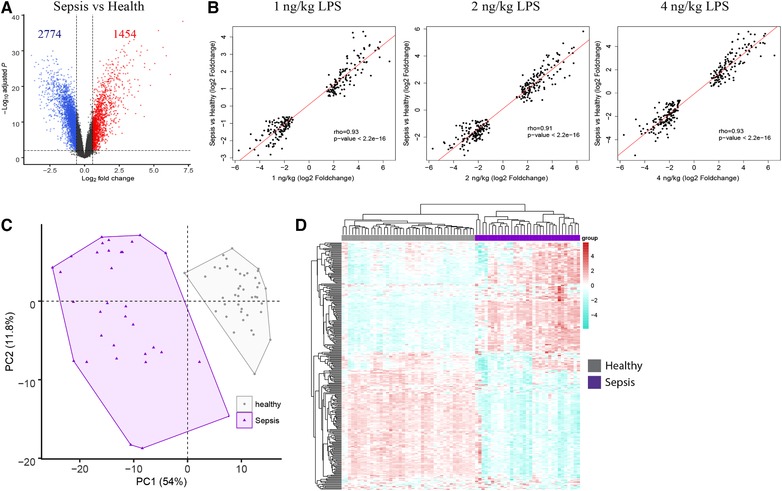
Figure 4.

Comparison of LPS dose‐dependent signature genes to sepsis due to abdominal Escherichia coli infections. (A) Volcano plot depicting the differences in gene expression of sepsis patients relative to healthy subjects. Horizontal line represents the multiple‐test adjusted significance threshold (P < 0.01) and vertical line represents the log fold change (FC = ±0.58). (B) Dot plot depicting the correlation (rho, Spearman correlation coefficient) comparing the 295 gene set in 1, 2, and 4 ng/kg LPS dosages to sepsis patients relative to health. (C) Principal component analysis (PCA) of the 295 gene LPS dose–response signature in sepsis patients and healthy subjects. (D) Unsupervised heatmap plot of the 295 gene signature in sepsis patients. Columns depict samples; rows depict gene expression indices. Red denotes overexpression; blue denotes underexpression
