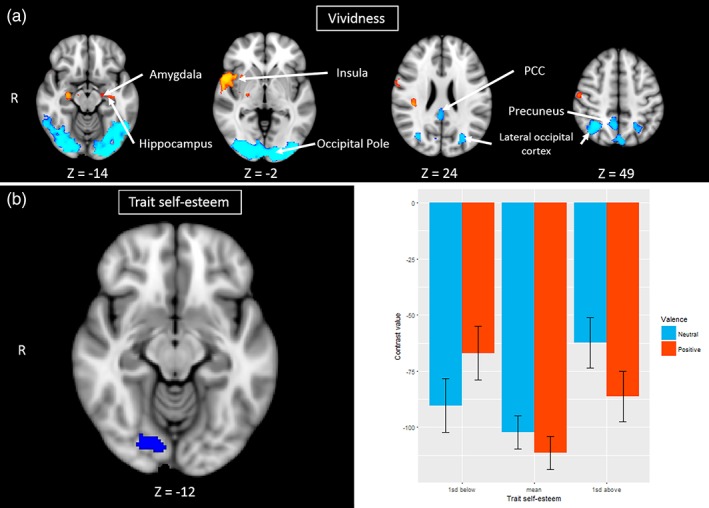
Figure 3.

Neural activation of (a) vividness of the memory that is either positively (orange) or negatively (blue) related (permutation test with TFCE) and (b) trait self‐esteem that is negatively (blue) related to the difference in reliving positive versus neutral memories (cluster threshold, z = 3.1, p < .05. The error bars in the bar plot represent 95% confidence intervals. Note: Brain is depicted in radiological convention, that is, left = right
