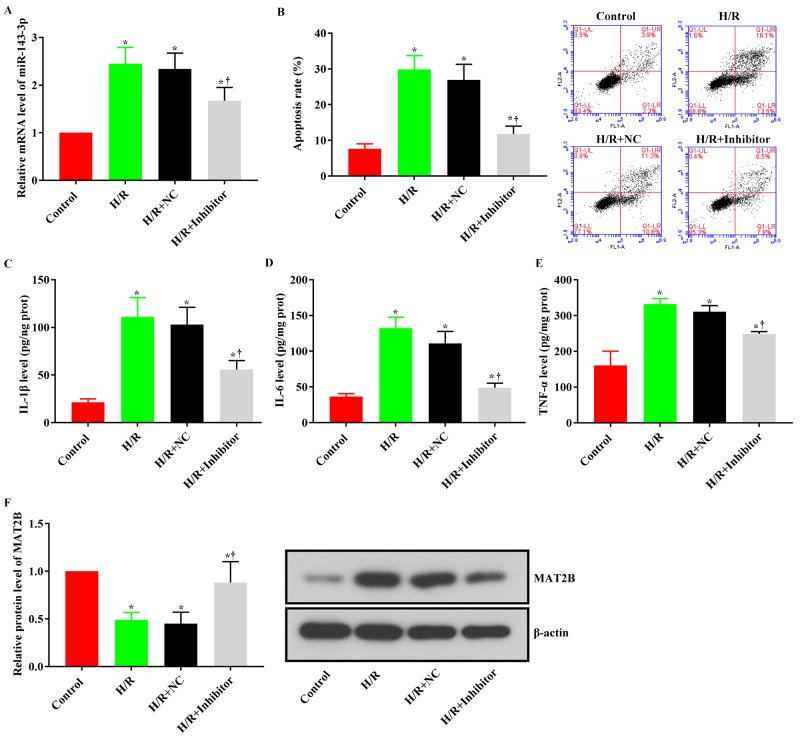
Figure 6.
Inhibition of miR-21-3p ameliorated hypoxia/reoxygenation-induced damage in SH-SY5Y cells. (A) Quantitative analysis of reverse transcription real time polymerase chain reaction detection of miR-21-3p. (B) Quantitative analysis and representative images of flow cytometry detection of apoptosis. (C) Quantitative analysis results of IL-1β. (D) Quantitative analysis of IL-6. (E) Quantitative analysis of TNF-α. (F) Quantitative analysis and a representative image of Western blotting detection of MAT2B. Asterisk indicates P < 0.05 vs control group. Dagger indicates P < 0.05 vs H/R+Inhibitor group. Each assay was replicated six times. NC – negative control. H/R – hypoxia/re-oxygenation.

