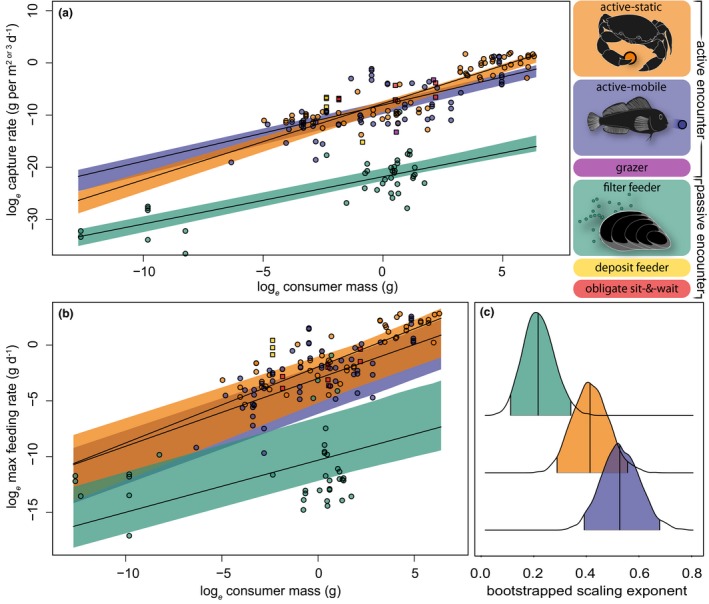
Figure 3.

Consumer size scaling of resource capture rates (a) (n = 185) and maximum feeding rates (b) (n = 148) with encounter strategy, and (c) scaling exponents indicating resource density‐dependence of capture rates among strategies. Solid lines in (a) and (b) are predictions from lowest scoring mixed effects models (Fig. 4); shaded areas are bootstrapped 95% confidence intervals (a–c). Capture and maximum feeding rate data points from small‐n groups are shown but not modelled (all square points in (a) and (b), non‐pictogram colour blocks in key). Ridge plots (c) produced using the R package ggridge (Wilke 2018).
